On Slicks and Satellites: An Open Source Guide to Marine Oil Spill Detection
Almost every week, oil spills are reported somewhere in the world. From ships dumping contaminating ballast water or breaking down on coral reefs, to direct attacks on oil pipelines and tankers. The larger the spill, the bigger the media attention.
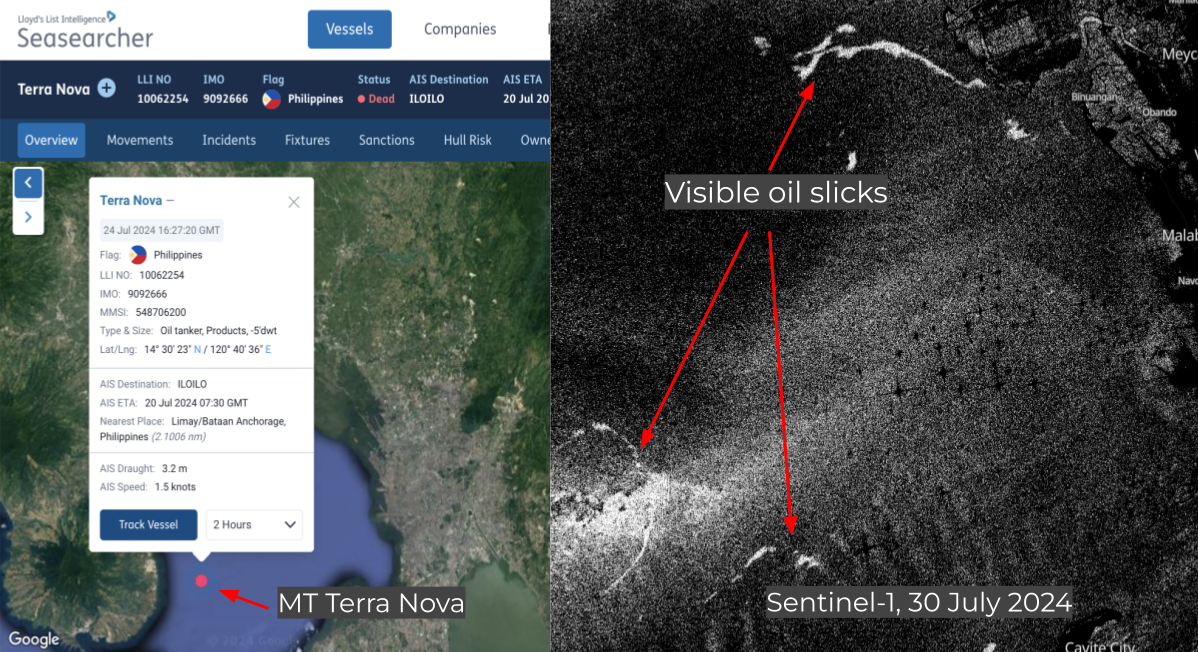
This year alone, off the coast of Trinidad and Tobago, a Bellingcat investigation found that 1,000 tonnes of oil contaminated protected wetlands and wildlife sanctuaries after a barge capsized. In the Middle East, the Houthis targeted the Liberia-flagged tanker, Chios Lion. Carrying a cargo of crude oil, the strike resulted in a 200-kilometre-long oil slick. And in South-East Asia, in late July, the tanker, MT Terra Nova, carrying 1.4 million litres of industrial oil, capsized off the coast of Manila in the Philippines, causing a four-km-long engine oil spill.
The sheer scale of ocean oil pollution is staggering. In Europe, a suspected 3,000 major illegal oil dumps take place annually, with an estimated release of between 15,000 and 60,000 tonnes of oil ending up in the North Sea. In the Mediterranean, figures provided by the Regional Marine Pollution Emergency Response Centre estimate there are 1,500 to 2,000 oil spills every year.
The impact of any single oil spill on a marine or coastal ecosystem can be devastating and long-lasting. Animals such as birds, turtles, dolphins and otters can suffer from ingesting or inhaling oil, as well as getting stuck in the slick. The loss of water and soil quality can be toxic to both flora and fauna. Heavy metals enter the food chain, poisoning everything from plankton to shellfish, which in turn affects the livelihoods of coastal communities dependent on fishing and tourism.
However, with a wealth of open source earth observation tools at our fingertips, during such environmental disasters it’s possible for us to identify and monitor these spills, highlight at-risk areas, and even hold perpetrators accountable.
A Spectrum of Slicks
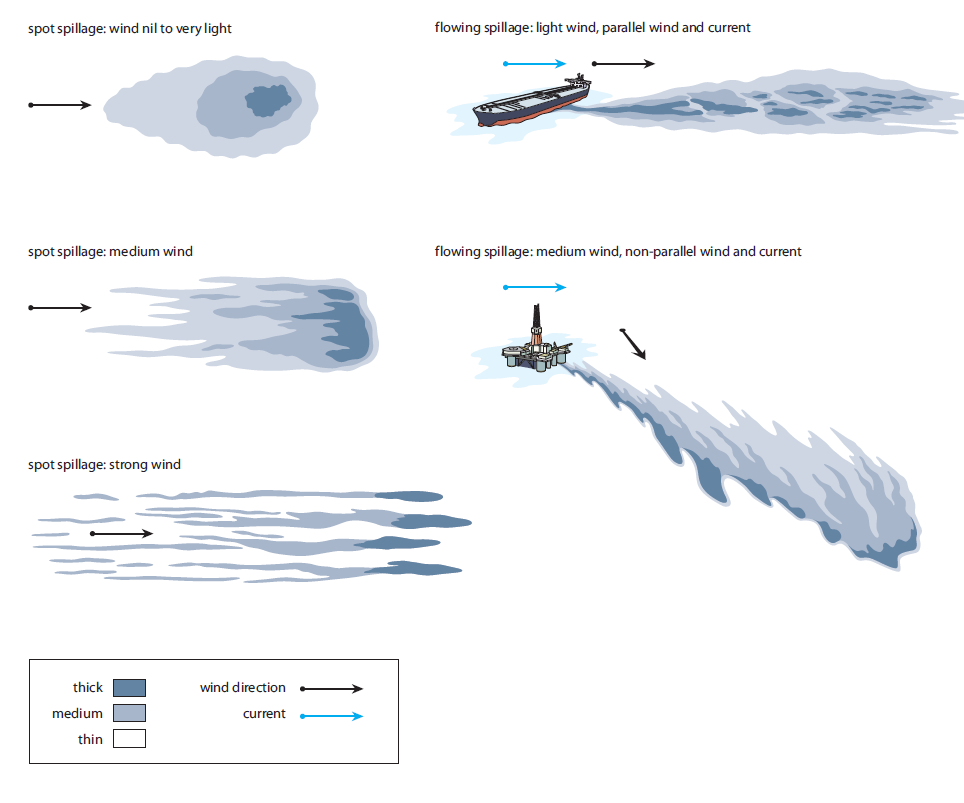
Oil spills come in many forms and shapes, depending on the oil type, water and weather conditions.
Most frequent are small spills, mid-sea, often from vessels dumping contaminated waste or ballast water. Larger spills can result from collisions between boats, capsizing in bad weather, or during ship to ship transfer of crude oil and petroleum products.
In the last decade there have been a number of larger incidents, with oil tankers being targeted during covert operations or by non-state armed groups. There have been numerous accidents at mooring stations, whilst loading or unloading oil products along pipelines. As well as spills that originated in-land, from dumping or accidents at storage sites.
How to Identify an Oil Spill
The National Oceanic and Atmospheric Administration (NOAA) toolkit offers solid guidance on how to recognise and label different types of oil and how they might appear on the water.
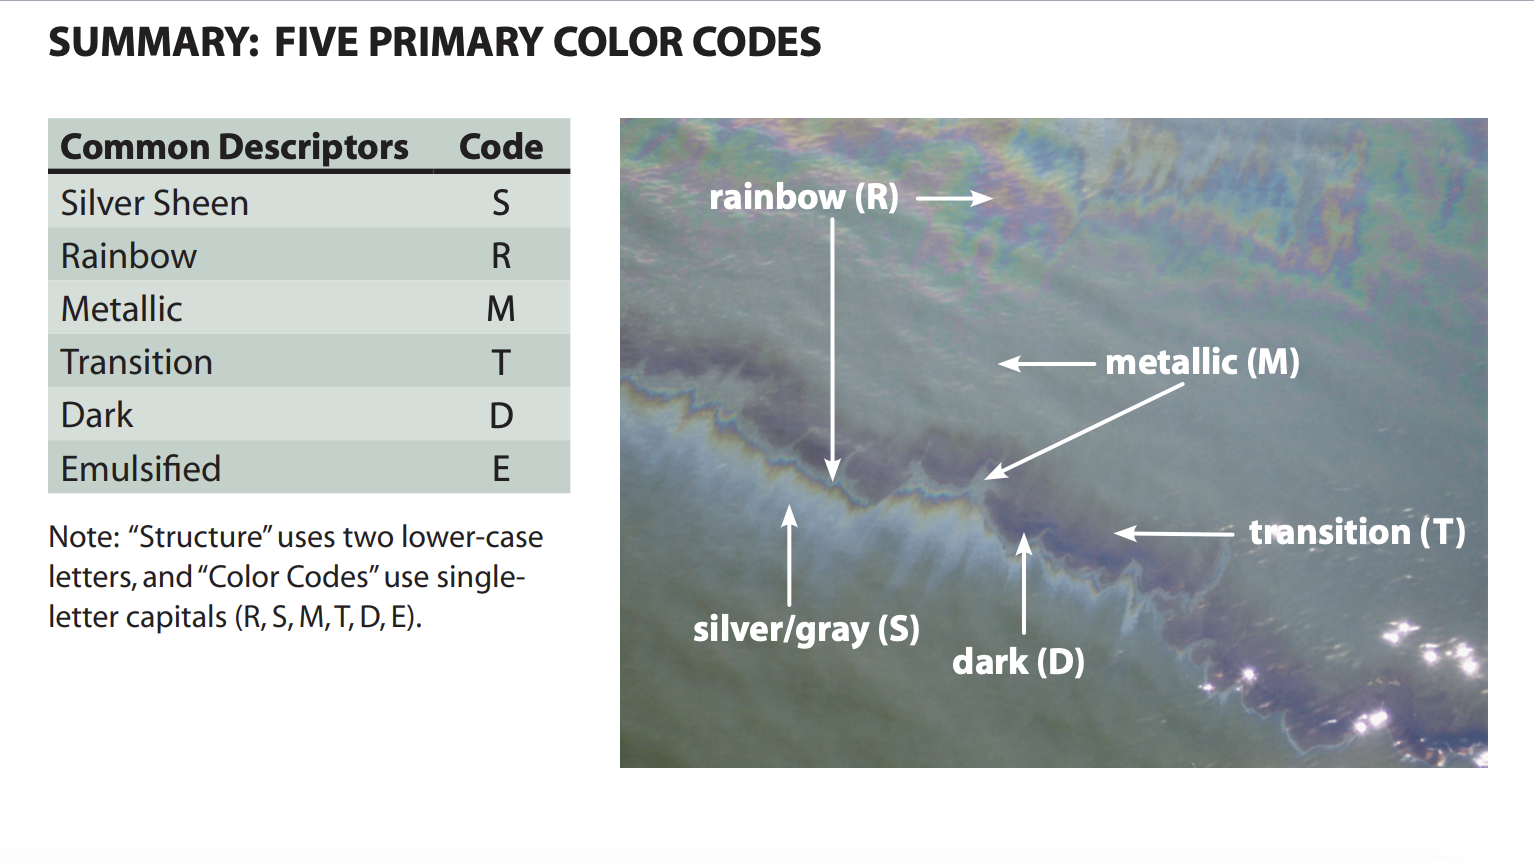
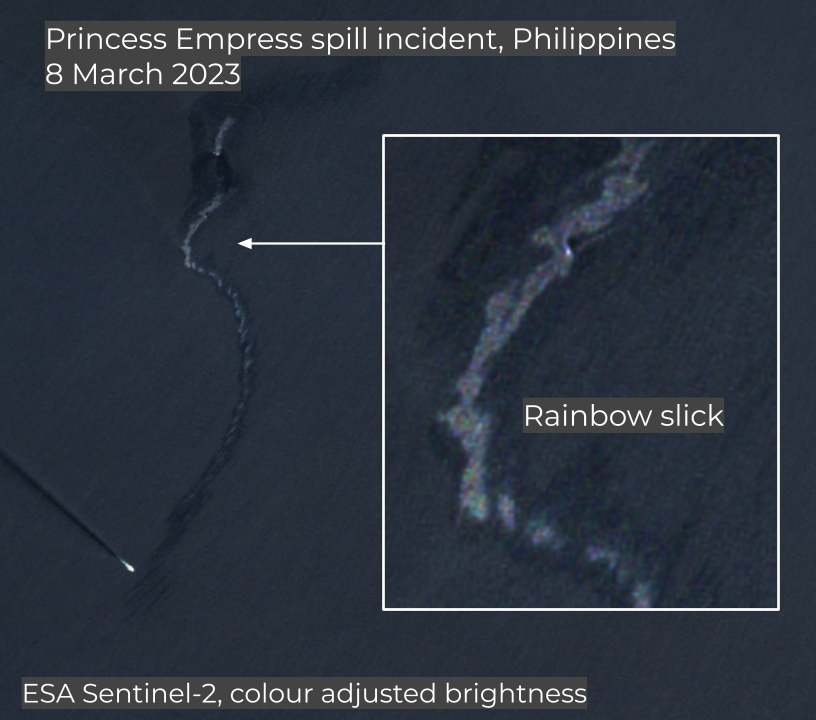
Diesel oil, being much lighter than other types, disperses and evaporates more easily, often creating rainbow formations (see above) on the surface of the water. It is more likely to evaporate in open water compared to thicker composites, such as crude oil or heavy fuel oil used in engines. When viewed from above, metallic or silver sheens will be seen emanating from darker areas.
Additional tools to NOAA include the Australian Marine Authorities Oil Spill Aerial Observation and Identification guide and the International Petroleum Industry Environmental Conservation Association (IPIECA) Guidelines.
Using Satellites to Capture Oil Spills
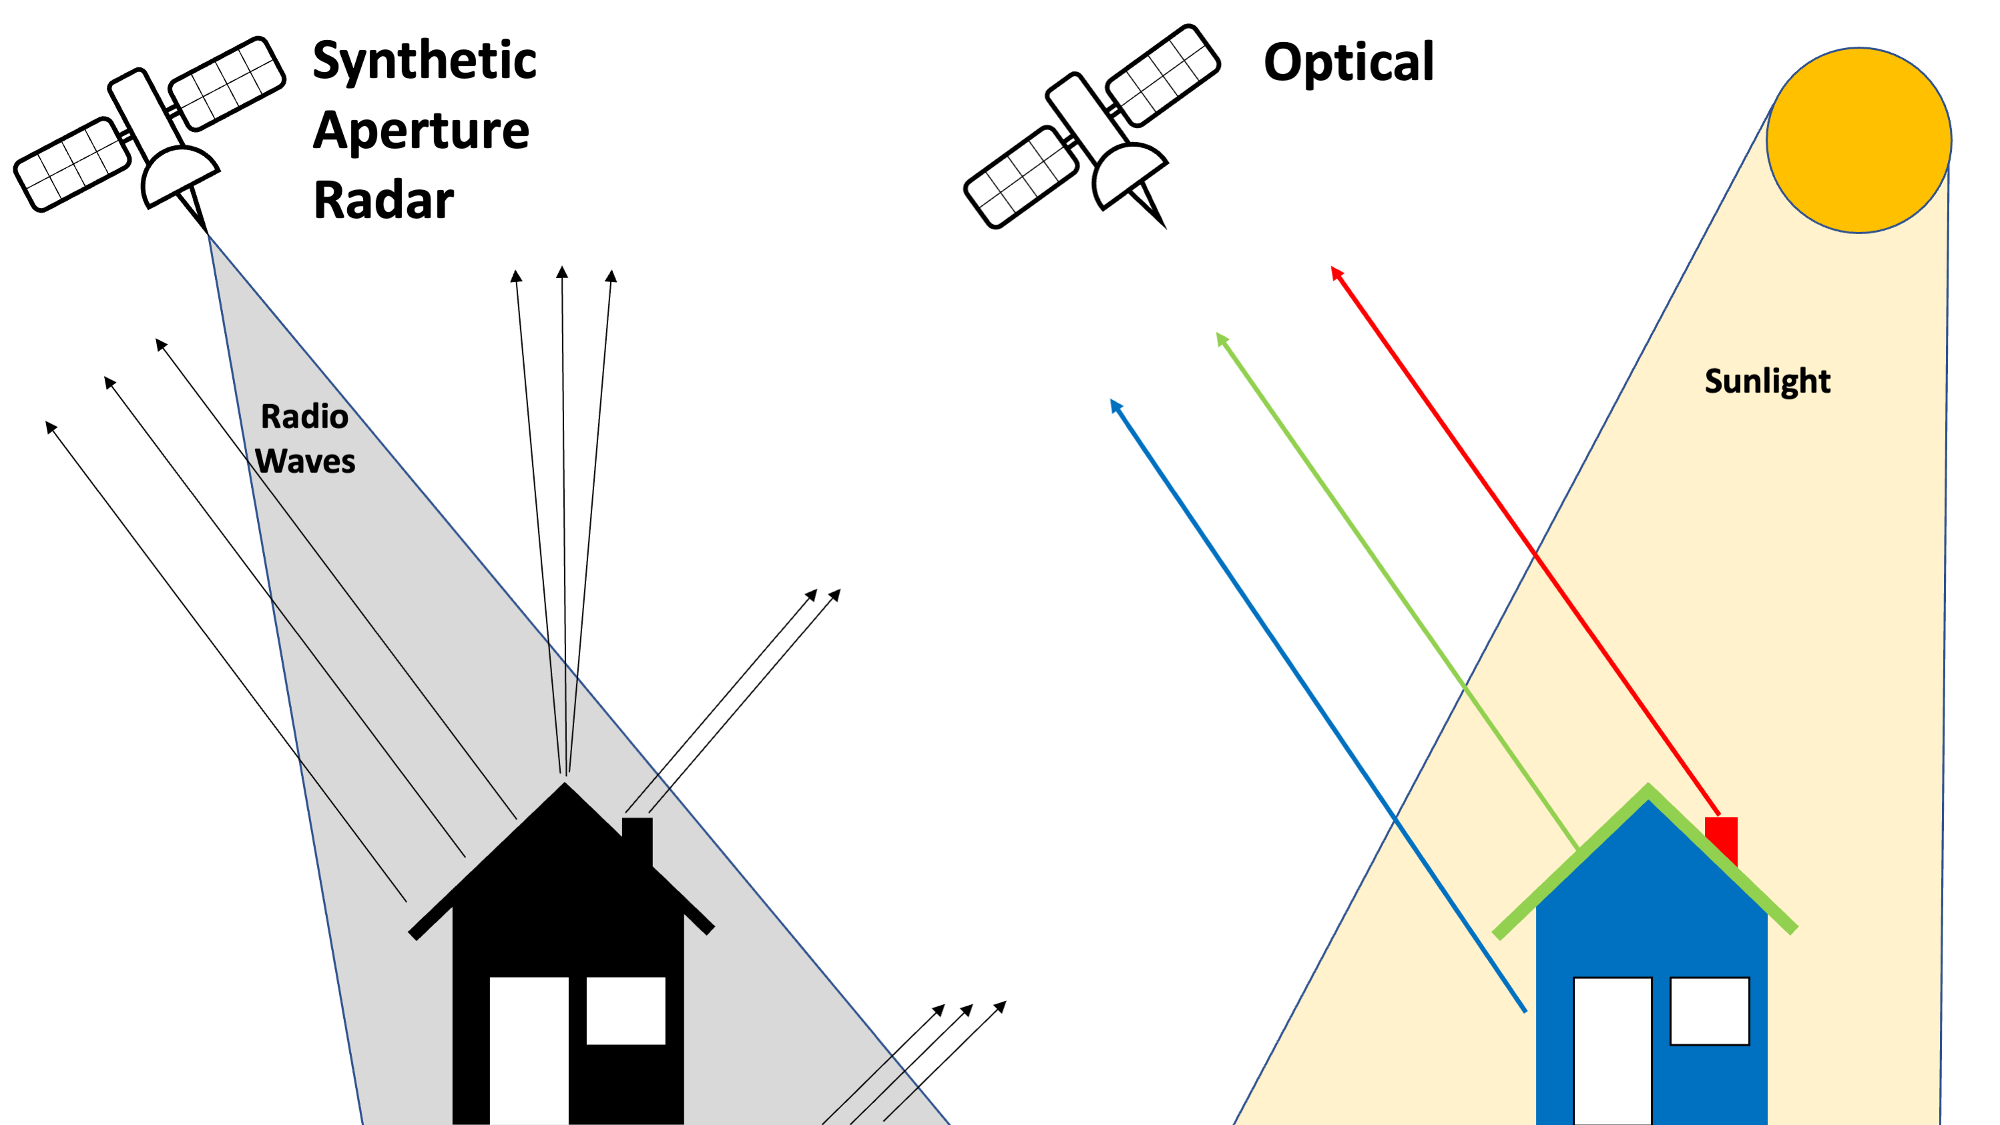
There are several different types of remote sensing sensors we can use for collecting data about the Earth’s surface. In this article we’ll focus on two: optical and radar sensors.
Optical imagery captures the broad light spectrum reflected from the Earth, also known as passive remote sensing. In contrast, Synthetic Aperture Radar (SAR) uses active remote sensing, sending radio waves down to the Earth’s surface and capturing them as they are reflected back. Any change in the reflection can indicate a change on ground, which can then be investigated. For more background, see Bellingcat contributor Ollie Ballinger’s Remote Sensing for OSINT Guide.
Optical Imagery
There are several earth observation platforms that provide free access to optical imagery, including the European Space Agency’s (ESA) Sentinel constellation and NASA’s Landsat data.
Both the Copernicus Browser and the Sentinel Hub EO Browser provide medium-resolution optical imagery (10-30m) that can be used to identify and track oil spills. The EO Browser offers a free 30-day trial to access all kinds of additional Earth observation sensors. While the Copernicus Browser has free anonymous or fully registered versions, both offer additional visualisation tools for creating time lapses or taking extra measurements.
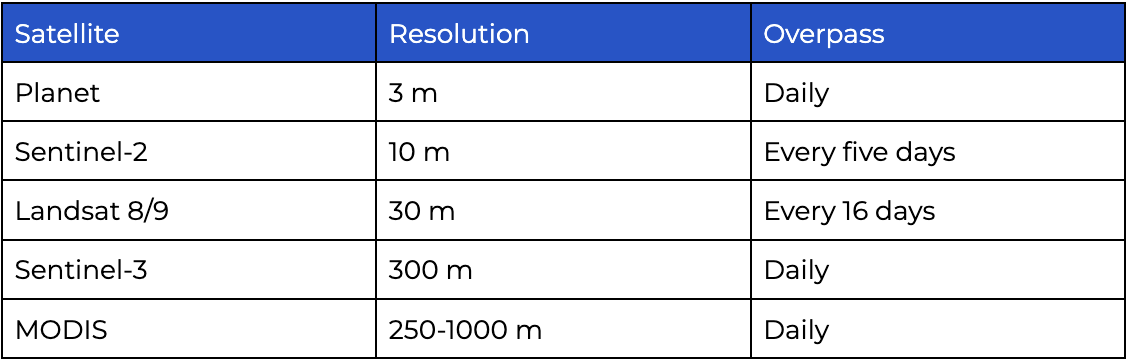
High resolution data (0.3-1m imagery) is also available for a fee from Planet Labs, Airbus, Maxar and Chinese satellites. On occasion, even historical imagery from Google Earth Pro has been used to provide evidence of oil spills.
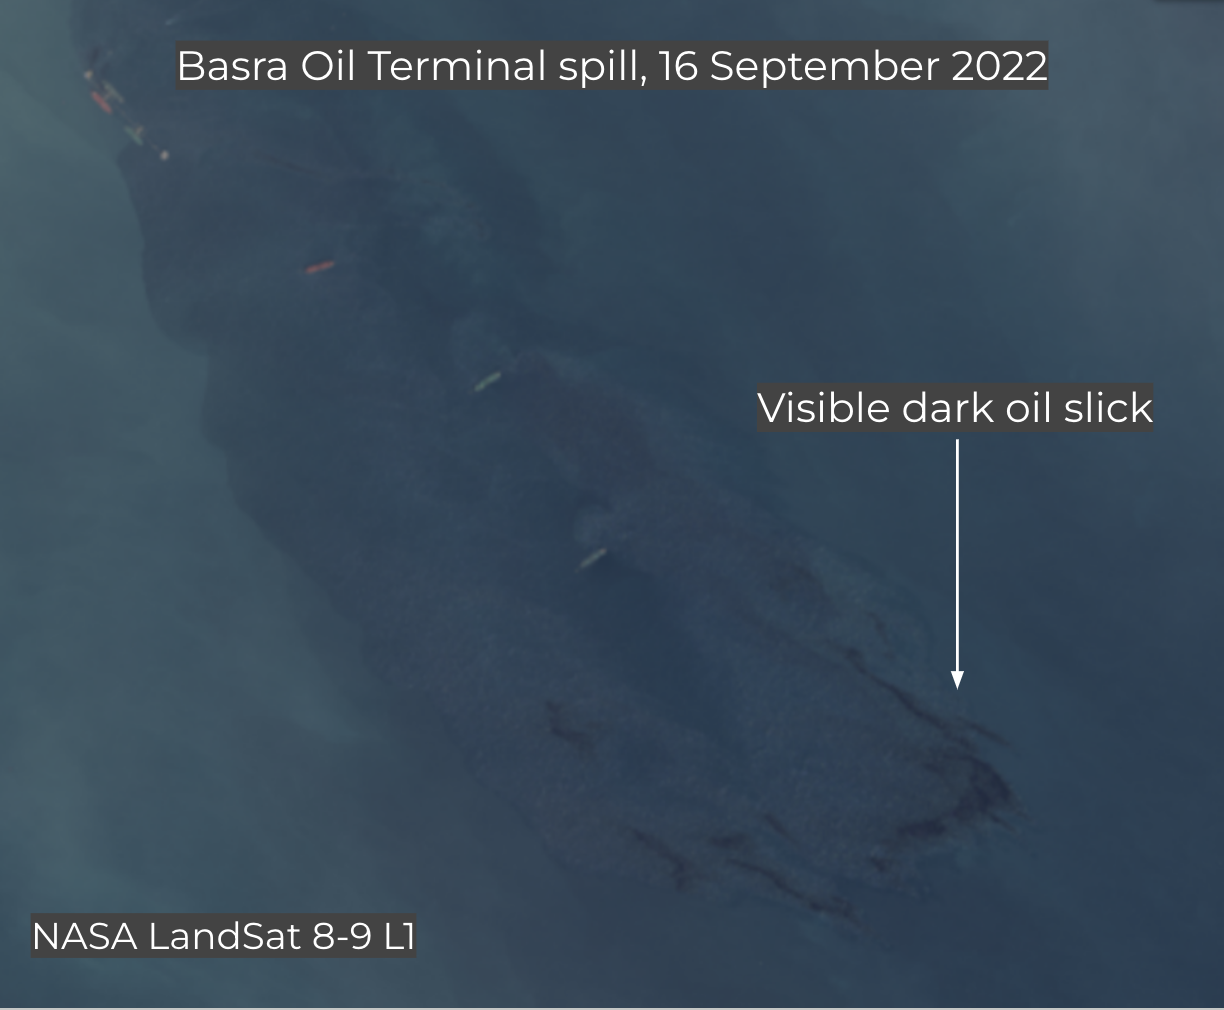
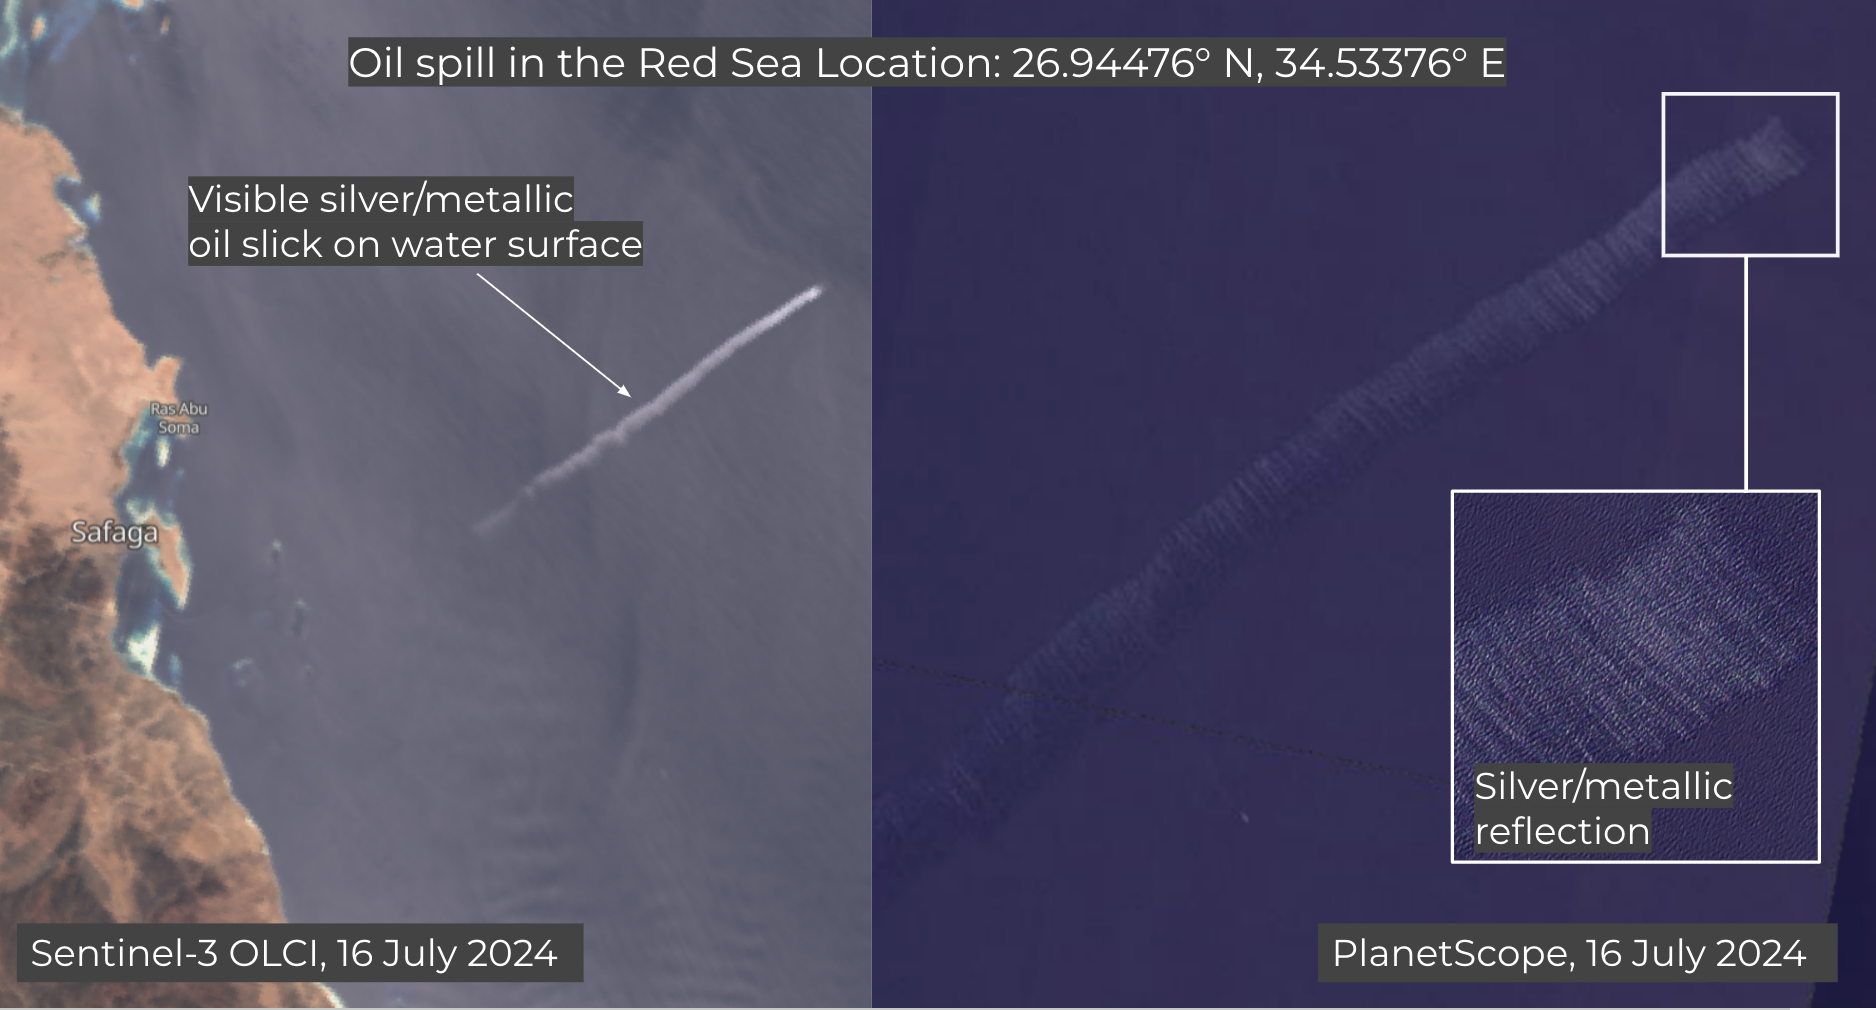
The most frequently available optical imagery comes from Sentinel-2, Sentinel-3, Landsat, MODIS and Planet. However, with low resolution options such as MODIS and Sentinel-3, unless an oil spill is very large or distinct, as shown in an example below with Sentinel-3, visibility may be limited.
As many satellites have a limited overpass time, you can use the ESA’s Orbital Prediction and Overpass Tool to check when the next satellite will be flying over and when the next new image of a spill will be available.
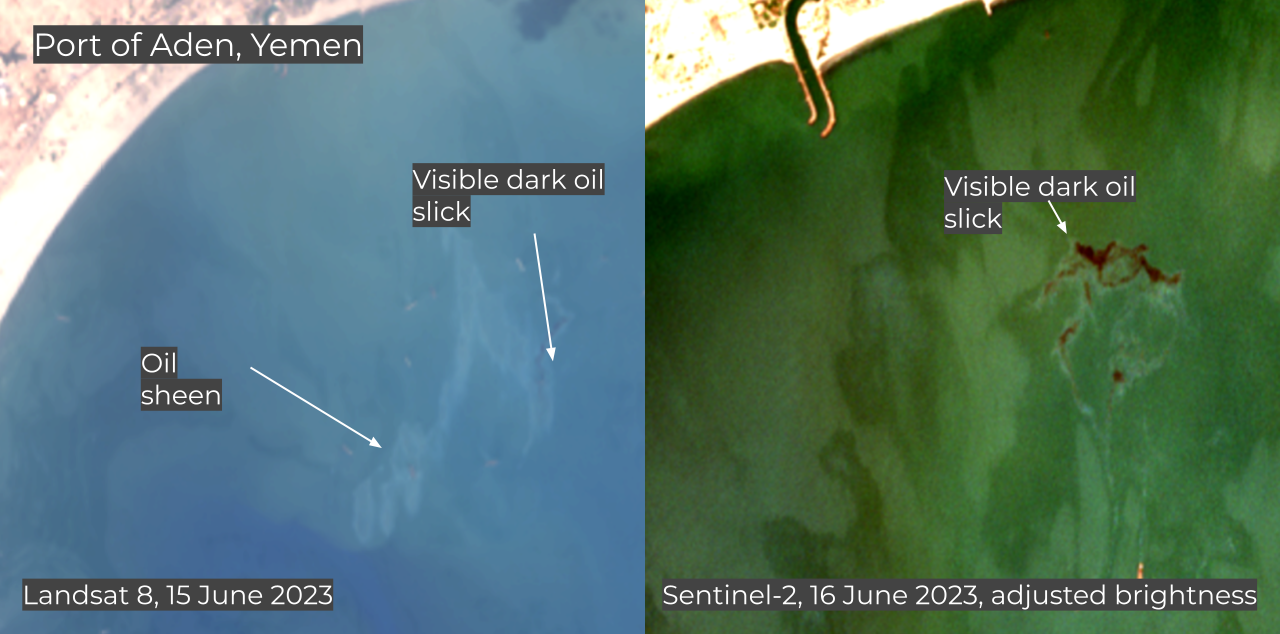
In both the EO and Copernicus Browsers, there are several tricks to improve your image. For example, it can be helpful to play with the colour adjustment to get a better view of the spill formation. Below are two images of the same oil spill off of the coast of Yemen, but with slight colour adjustments.
We can also exploit different spectral bands, different wavelengths of light, in Sentinel Hub and Copernicus Browser. Both browsers include pre-sets of mixed bands, each of which has a specific function depending on the researcher’s needs.
Each optical instrument in a satellite has a different number of spectral bands, 13 in the case of Sentinel-2 and nine in the case of Landsat-8, with Red, Green and Blue (RGB), Near-infrared and Short-wave Infrared (SWIR). The different combinations of these sensors can help to visualise specific reflections in the light spectrum, helping to distinguish water from soil and different types of vegetation. More information on using Sentinel-2 for oil spills can also be found in this helpful article.
Using Custom Scripts, pre-written Javascript code by the open-source remote sensing community, can also help with a range of visualisations, ranging from deforestation to flood mapping, to wildfire visualisation.
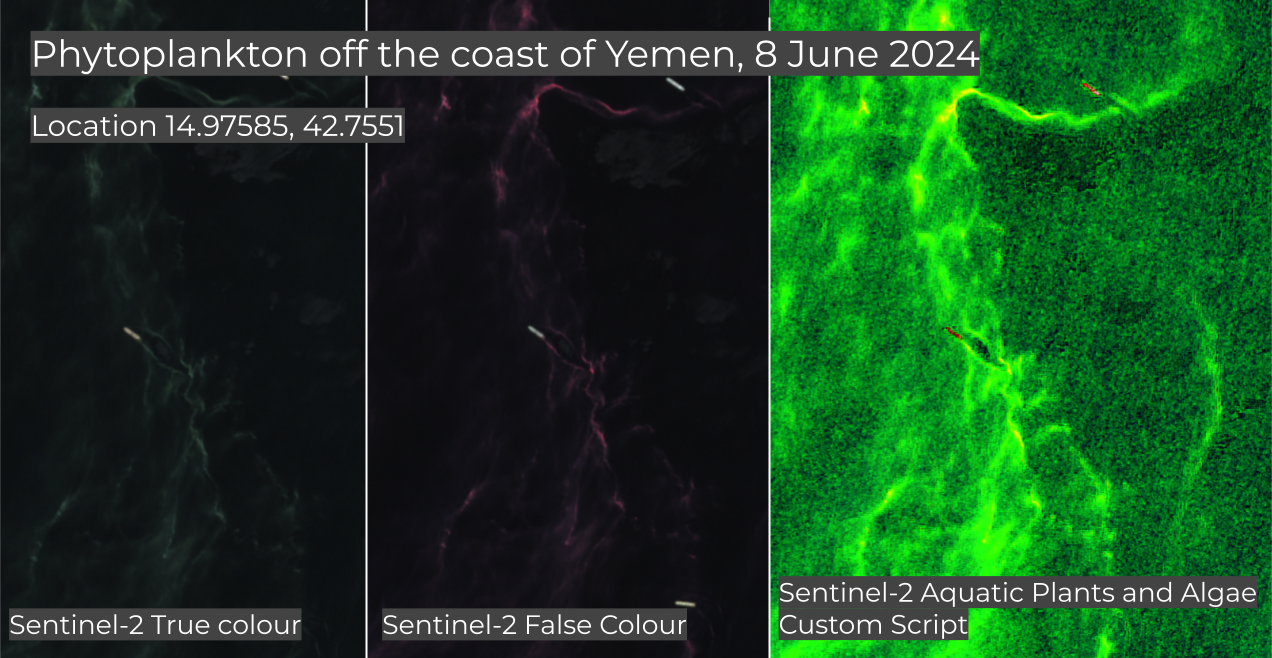
In the GIF below, we are using Sentinel-2 scripts written to help identify phytoplankton. There are several other Sentinel-2 scripts in the Oil Spill Index, with the caveat that oil isn’t always very distinct using these scripts. However, in the SAR section that follows we will allow for water surface roughness when analysing slicks.
Below we see a good comparison of a True Colour, False Colour and Custom Script for Algae detection off the coast of Yemen. In this case we can use the False Colour Index to check if a reflection is algae or oil. As algae has red reflection, indicating vegetation, the Custom Script highlights it even more.
Radar Imagery
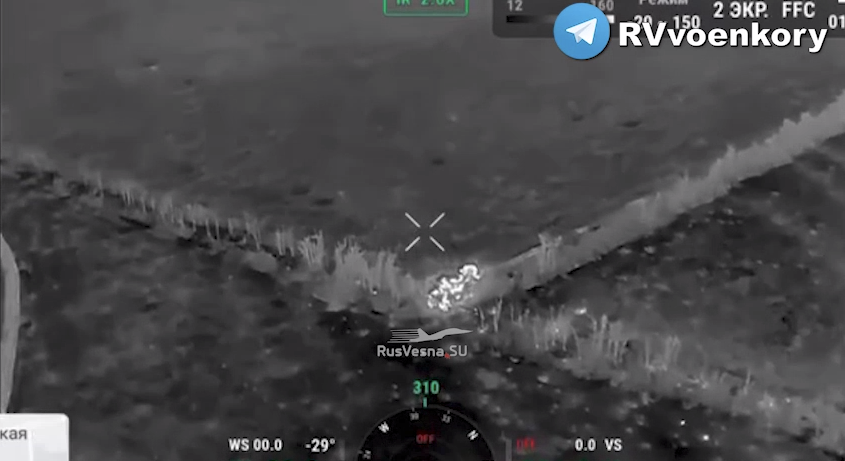
SAR sends radio waves to the Earth and then records the signals reflected back in order to create an image. It uses both horizontal (H) or vertical (V) polarisation, meaning the direction of travel of an electromagnetic wave. By using different angles to send and receive signals, the sensor is able to pick up on all kinds of different shapes and structures. Over time, it can also detect whether they change, which is essential for many environmental investigations.
Compared to optical imagery, SAR is able to penetrate the clouds (if not too heavy). It’s also particularly useful for detecting oil on the surface of the water. As wind creates small waves on the water surface, the thickness of the oil dampens these small waves and makes the surface flatter. This change in surface texture changes the reflection of radar signals, causing the oil-covered areas to appear darker than the surrounding water.
In the examples below, we are using Sentinel-1, as it’s freely available. There are also commercial companies providing SAR data, some of which provide free accounts for researchers.
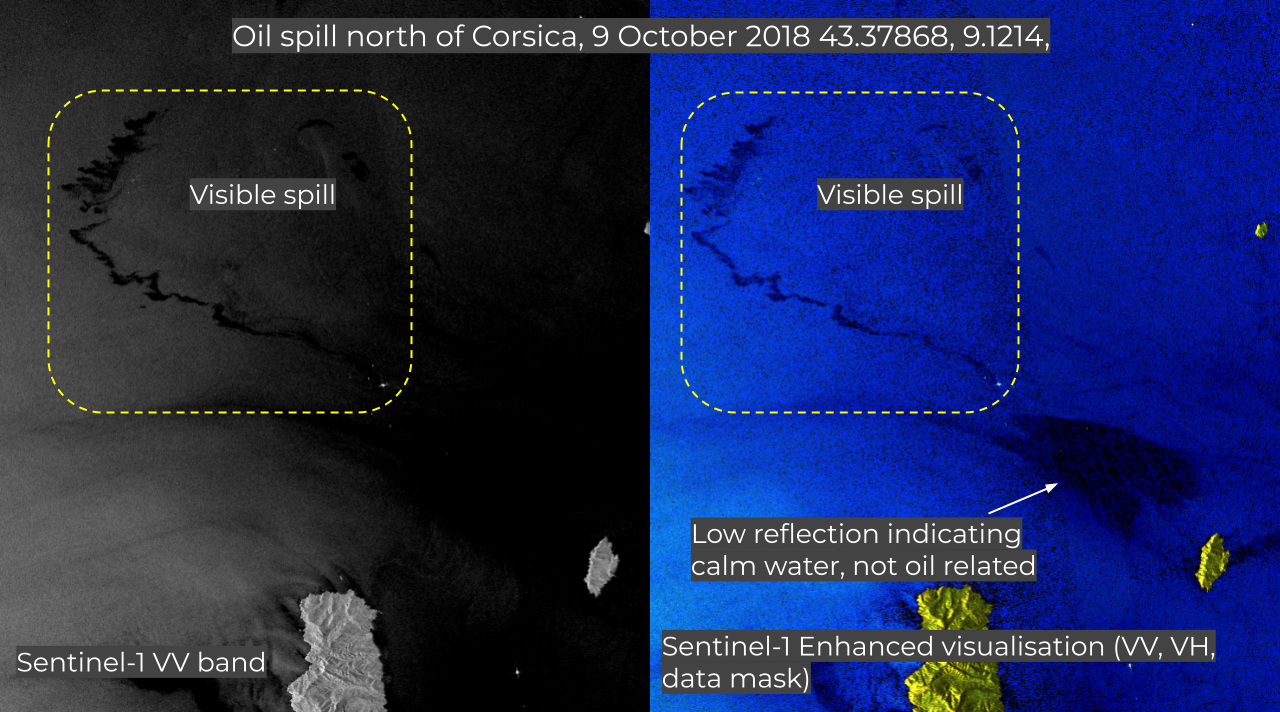
The images below show a huge oil slick in the Mediterranean Sea on 9 October 2018, after a Tunisian ship crashed into a Cypriot container vessel, spilling 600 tonnes of heavy fuel. By comparing two band combinations of the same image, we can see how quickly we can make the spill much more visible.
But using an existing band combination is not always enough. Sometimes you need additional tools to identify a potential spill.
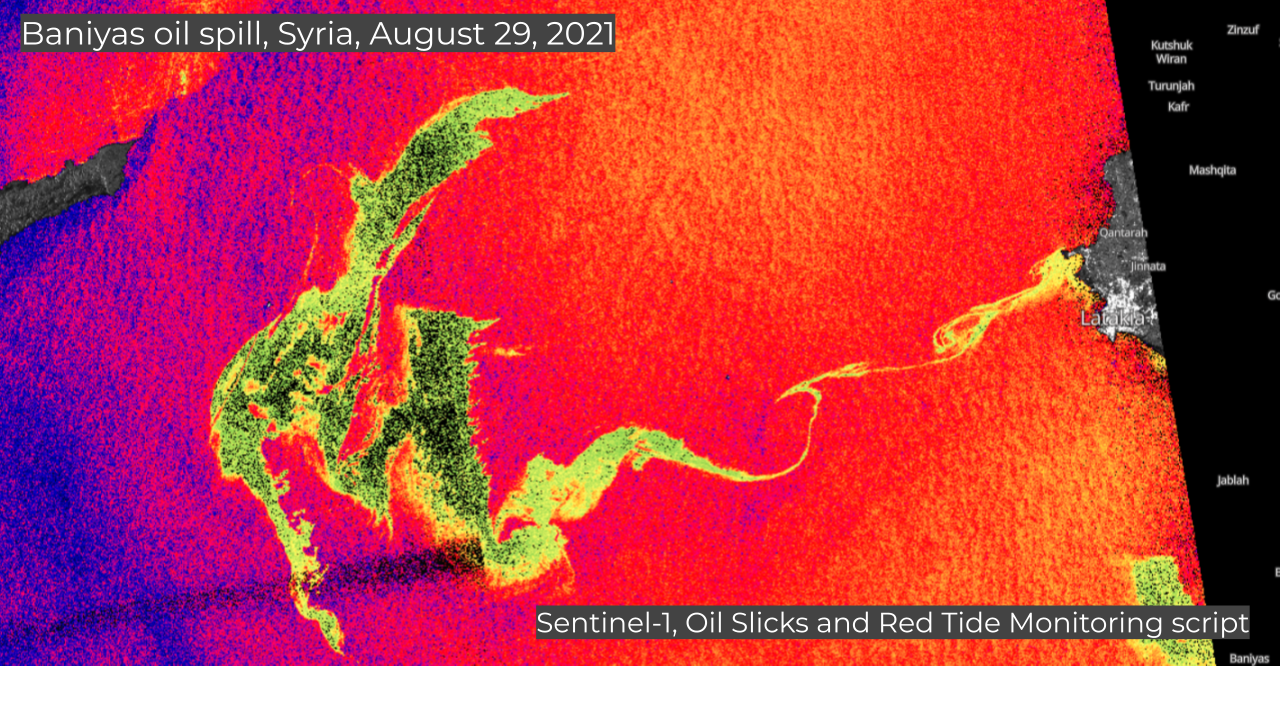
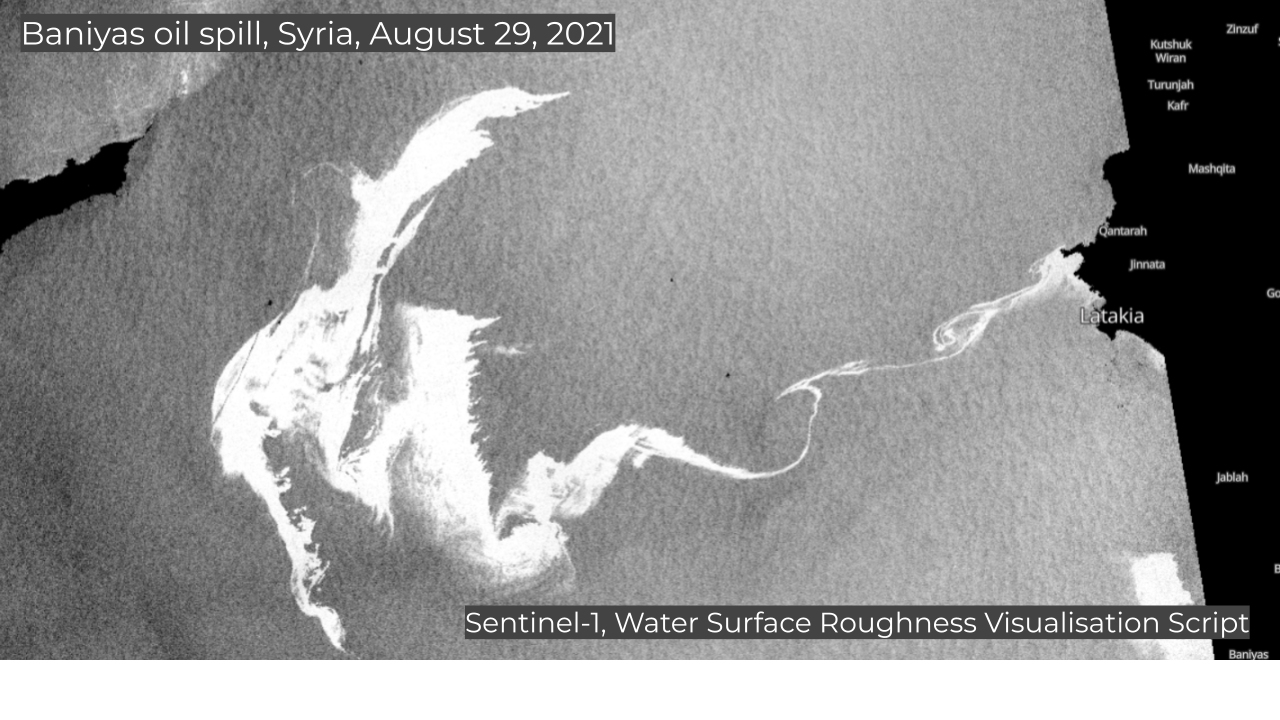
The EO Browser has a built-in Water Surface Roughness Visualisation script. Sentinel’s Custom Scripts database also offers a custom Water Surface Roughness Visualisation script and an Oil Slicks and Red Tide Monitoring script, both for use in the EO and Copernicus Browsers.
Below we apply both scripts to a massive oil spill that took place after heavy fuel oil leaked from a thermal power plant in Baniyas, Syria.
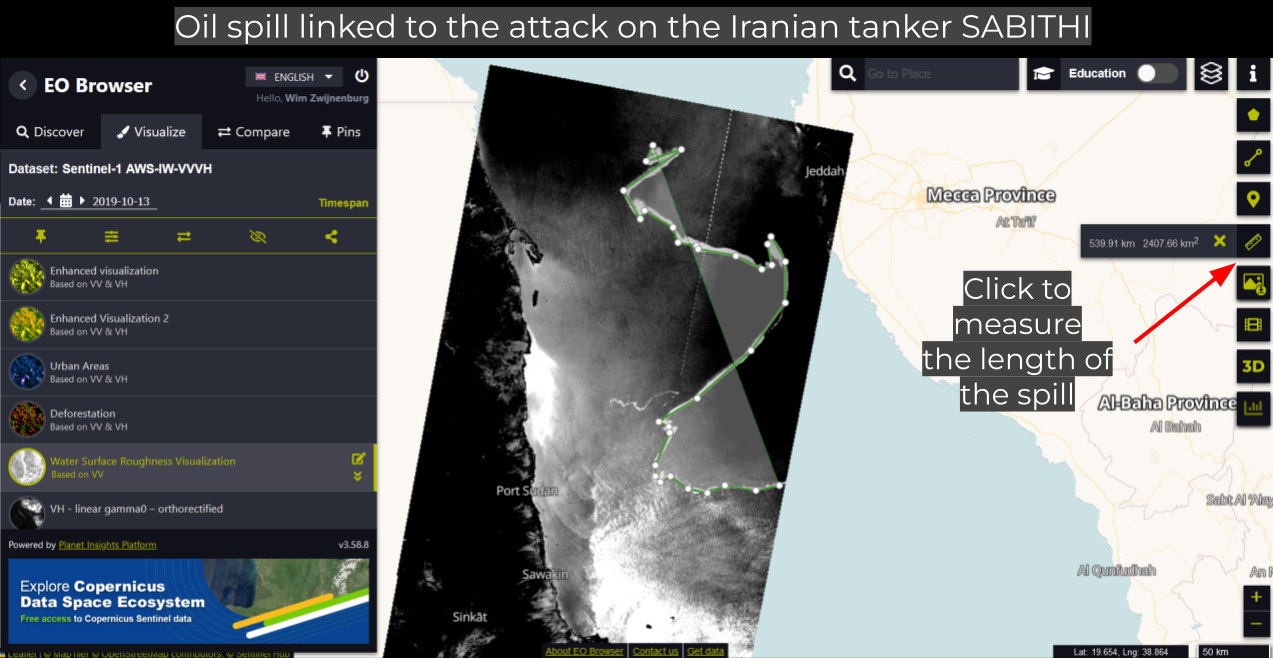
Both EO Browsers also provide a neat measurement tool to help determine the size of an oil slick. With enough patience you can measure all the way around the spill by clicking along its boundaries.
False Positives
It’s not uncommon to mistake natural phenomena for an oil slick.
Phytoplankton, a type of algae bloom, can easily appear and behave like an oil spill when viewed from a satellite. The trick is to check the same area months or even years earlier to see whether the algae has appeared before. Other plant life such as kelp, or in coastal areas red tide algae, are also worth looking out for.
Swarms of jellyfish and marine mucilage aka ‘sea snot’, which cause large white or greenish slicks on the surface of the water, can also be mistaken for oil spills.
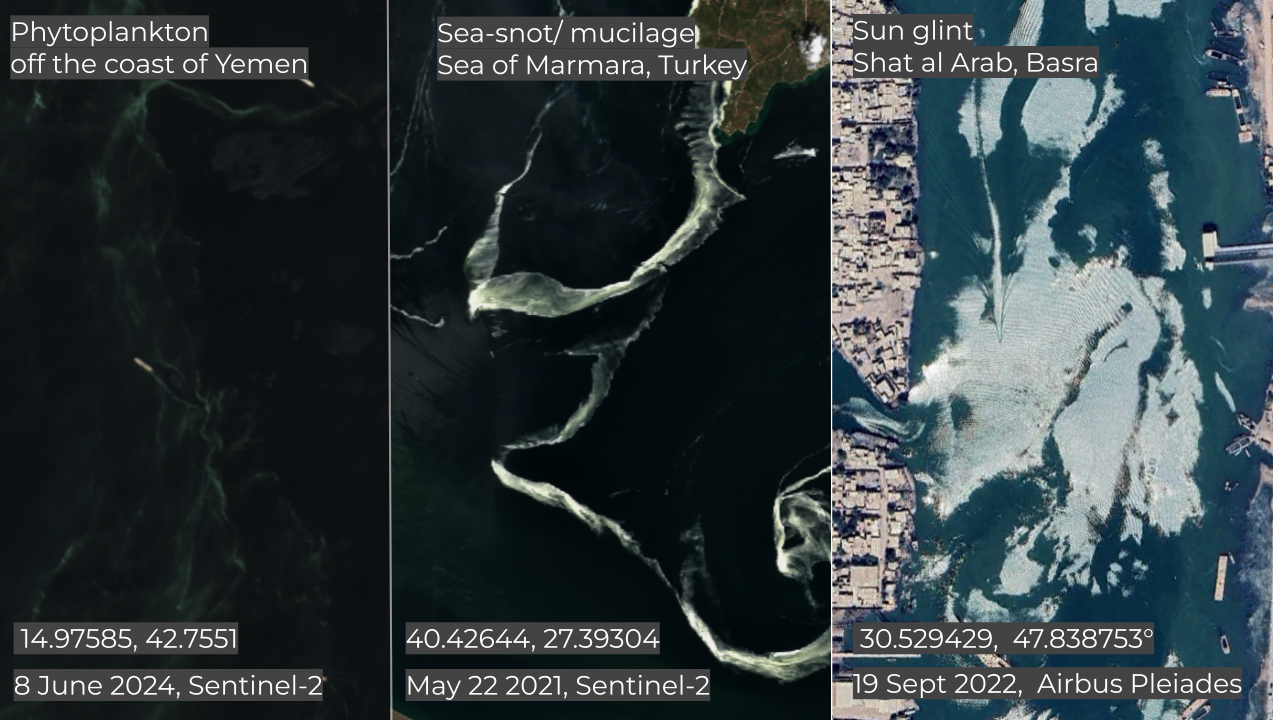
Optical illusions, such as sun glint, can cause rainbow-like reflections on the water. We encountered this during a Bellingcat investigation into an oil spill in Iraq. Variations in water surface roughness from wind or currents, can also be misidentified as oil slicks.
One recent case we believe to be a false positive, was off the coast of Ukraine. Sediment flowing out into the Black Sea, combined with fluctuations in water surface roughness, appears to have been misidentified as an oil spill and attributed to the ongoing conflict.
The National Academy of Sciences (NAS) of Ukraine said:
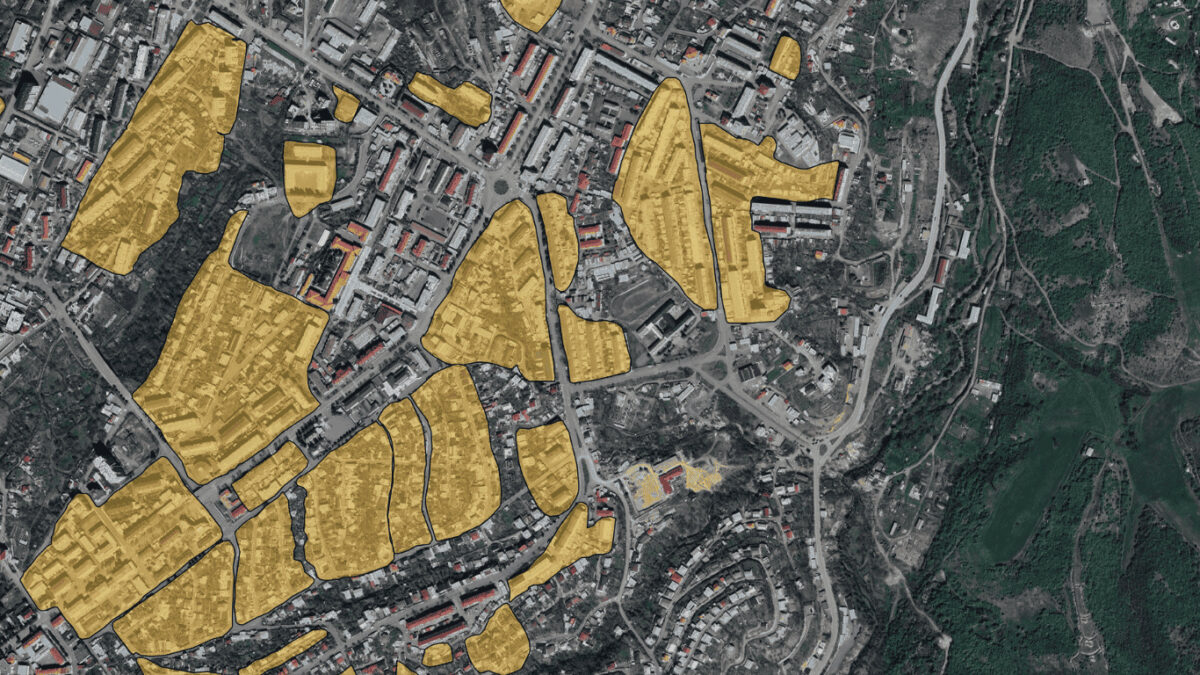
“In the three most valuable marine protected areas (MPAs) of the northwestern part of the Black Sea, using satellite information, almost 100% coverage of the sea surface by oil products was due to the destruction of ships and aircraft.”
The claim made by Ukrainian state-funded academics, was first published in November 2022 and then repeated in official reports, but without referencing any visual evidence.
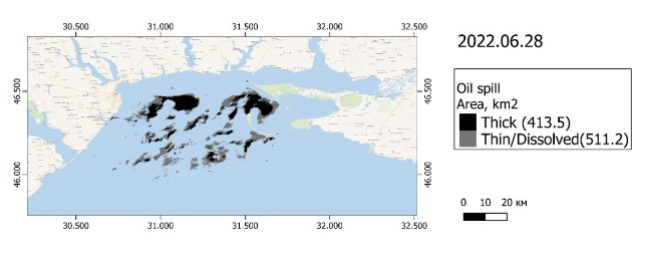
After reviewing Landsat and Sentinel-2 data, we found no visible signs of an oil spill. Given the size of the alleged incident, not only would the oil have stayed on the surface of the ocean for days, sizeable amounts would also have washed up on the nearby shore, of which there were no such reports.
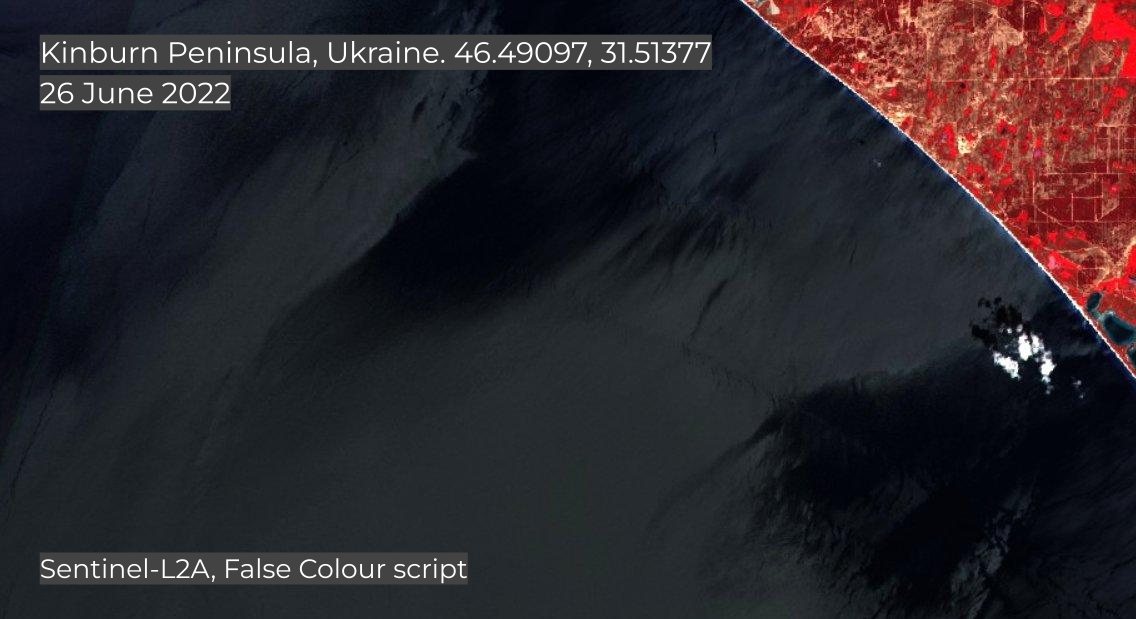
We believe it’s more likely the researchers misidentified differences in water surface roughness and sediment flow, as oil. On a few occasions algae streams were also visible.
We asked NAS of Ukraine for comment on our lack of ability to replicate their findings, and more clarity over their methodology but they did not respond.
With radar data you should always be wary of false positives. Water surface disturbance, which shows up on an image and resembles an oil slick, could have multiple causes, including downdrafts from storms, surfactants on the surface, sediment and wind. Make sure there is supporting evidence, such as optical imagery, social media footage or vessel tracking data, to help corroborate your findings.
High to Very High-Resolution Imagery
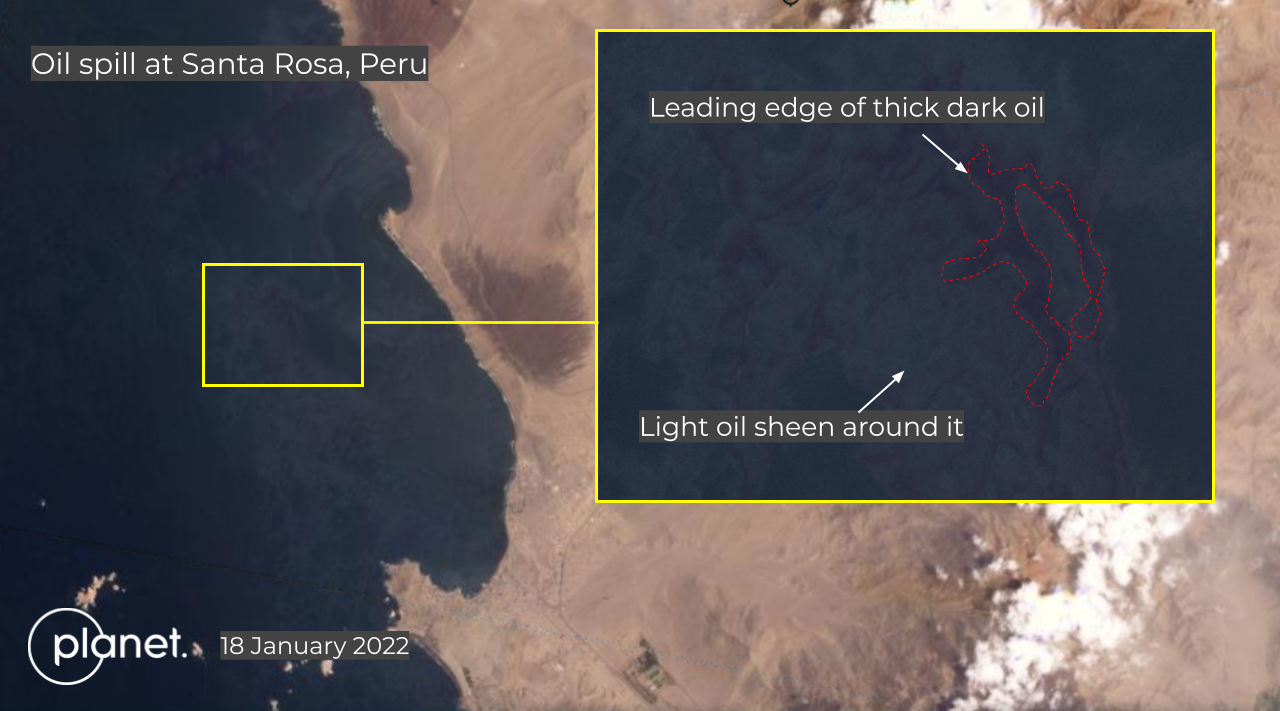
High-resolution 3m imagery from PlanetScope, with a daily overpass is also a good option when no Sentinel or Landsat imagery is available. Below is an image taken off the north coast of Peru when 2,100 tonnes of crude oil spilled into the Pacific Ocean.
In some cases, you might be able to check historical very high-resolution imagery using Google Earth Pro. Companies like Maxar and Airbus occasionally release it to raise awareness or support journalists with research.
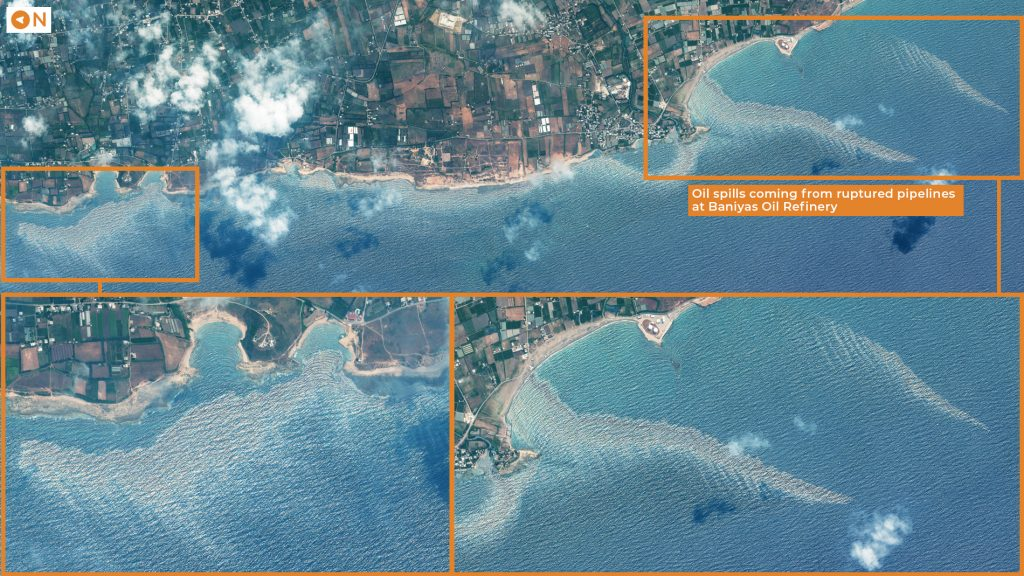
Below is an image of the Baniyas Oil Refinery, captured on WorldView-3 on 22 June 2019 and released by European Space Imaging, showing oil pollution, with a clear metallic colour reflection, and the light sheen of dispersing oil, escaping from an underwater pipeline explosion.
Combing Open Source Tools
With the increase in the use of artificial intelligence and automation on remote sensing data, there are an ever growing number of innovative and handy tools which combine open source techniques to help you with your research.
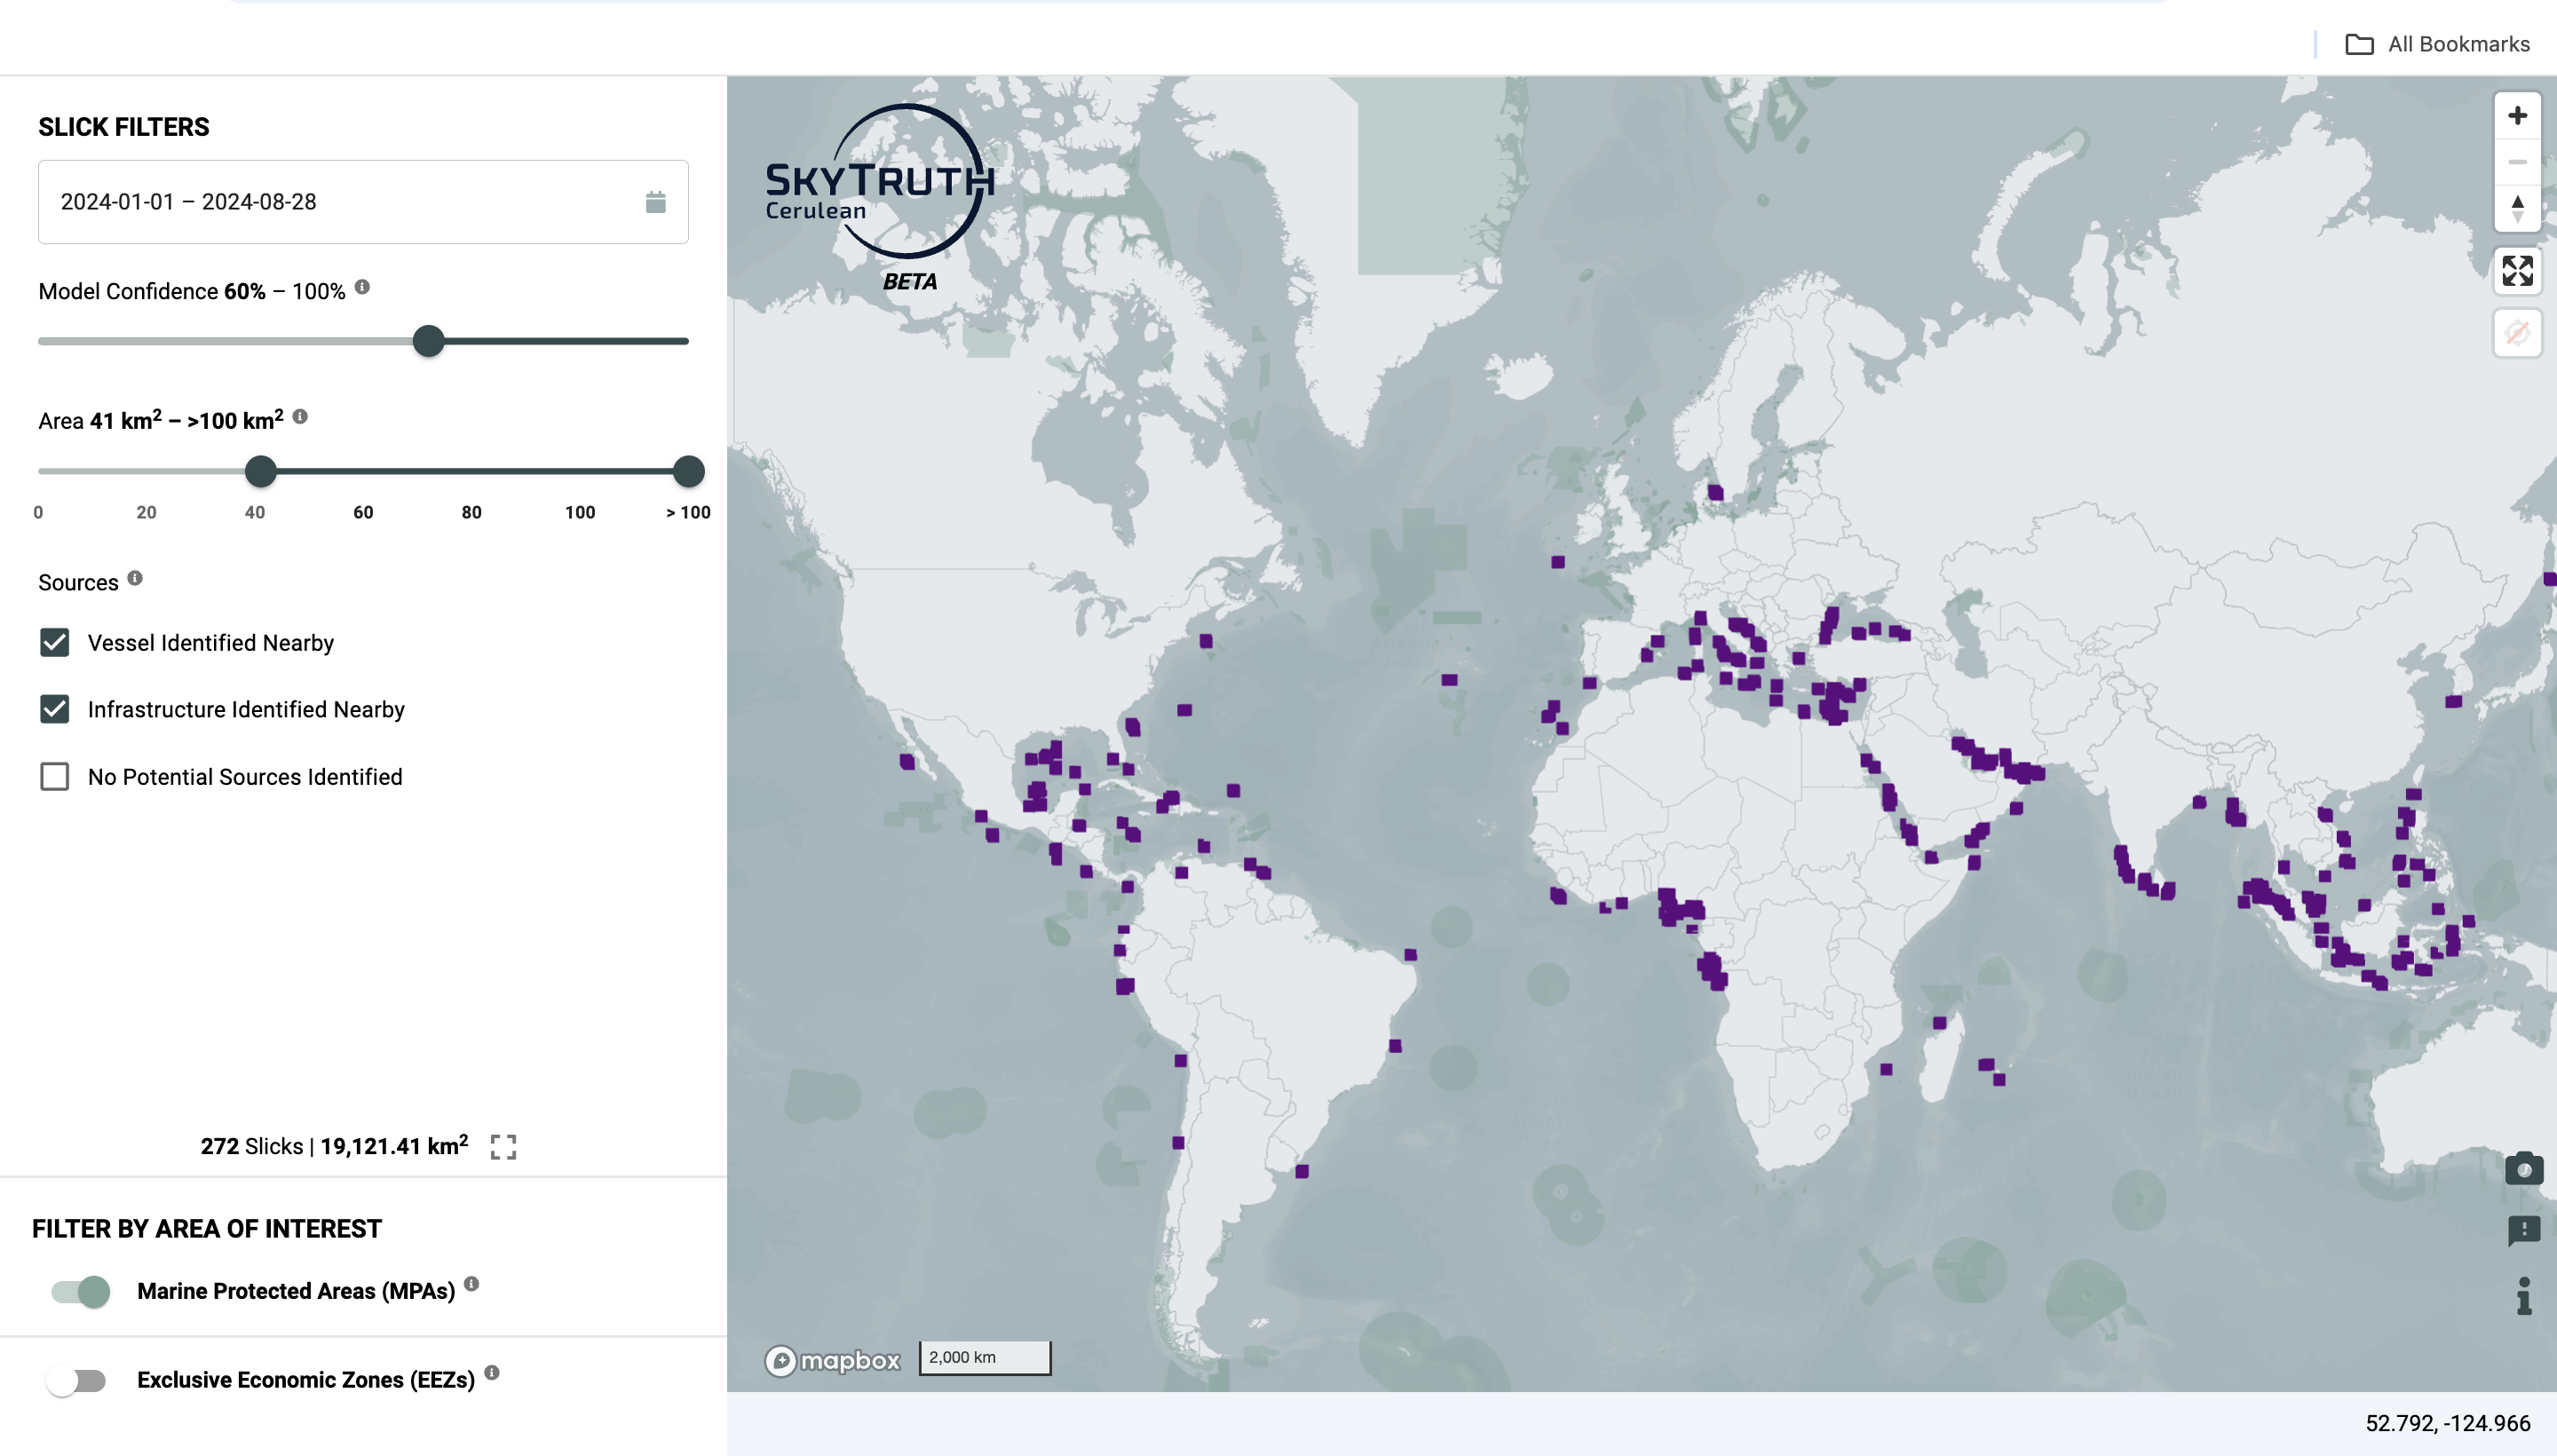
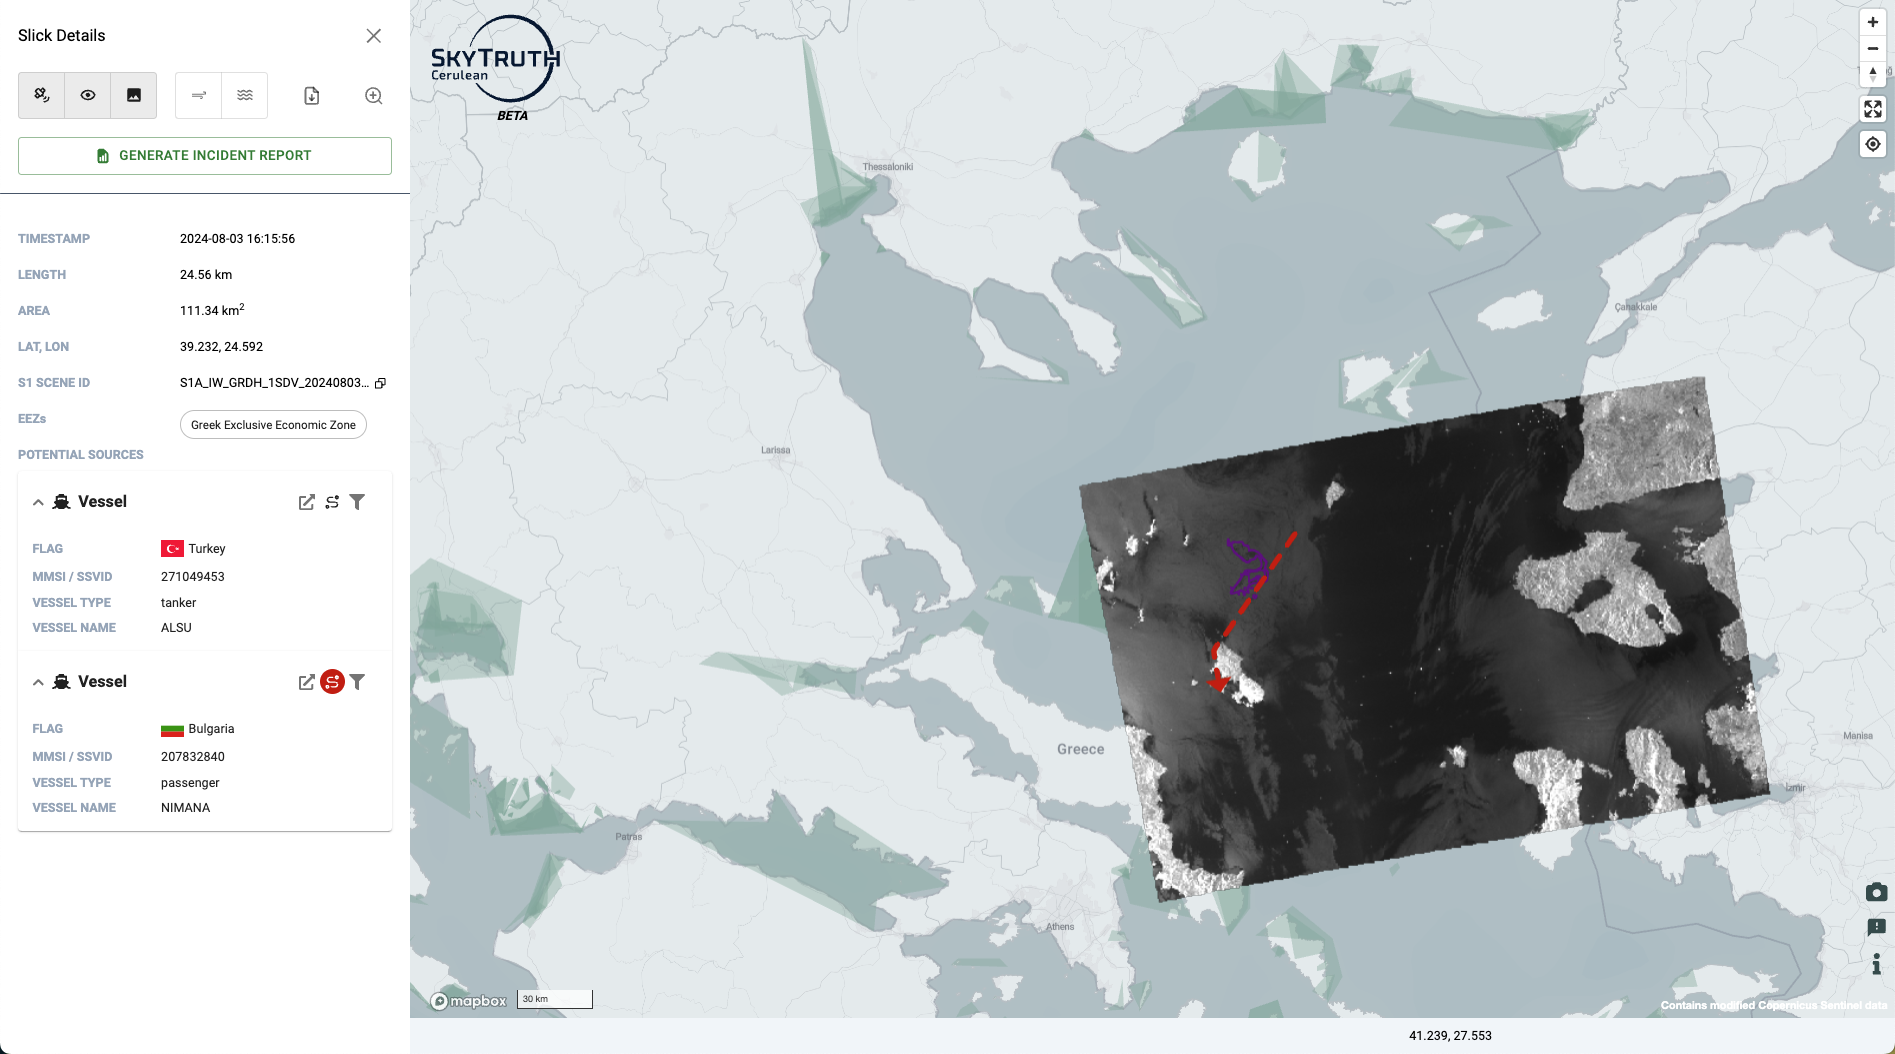
SkyTruth is a non-profit organisation, dedicated to making use of GIS and earth observation data to tackle environmental challenges. We used their flaring data tool in 2021 to investigate oil pollution in Iraq, and they are continuing to develop new methodologies. Their recent tool, Cerulean, a global monitoring system that combines Sentinel-1 SAR imagery with marine vessel tracking and oil platform data, applies machine learning to track spills and identify the potential source.
There are regional monitoring tools, such as NOAA’s Incident Map, an easy web-based map of any documented spills in U.S. waters. The Mediterranean Integrated Geographical Information System on Marine Pollution Risk Assessment and Response provides an overview for all Mediterranean coastal states. If you really want to go professional, there are also great online tutorials from Copernicus Research and User Support (RUS) on how to map an oil spill with Sentinel-1 using GIS software.
Tracking Down the Perpetrators
The source of an oil spill can be diverse, from drilling platforms, oil pipelines, mooring stations, to leaks from on-shore installations. But most often, the source is a ship. Usually, every vessel carries an Automatic Identification System (AIS) transponder, broadcasting its location to nearby ships and coastal authorities, as regulated by the International Maritime Organization (IMO). However, the signal can be disabled or turned off, known as a ‘dark ship.’ This could be for safety reasons, but more often, it’s to avoid detection while carrying out illegal activities such as smuggling or unregulated fishing. Marine platforms for vessel tracking include Seasearcher from Lloyd’s List Intelligence, Marine Traffic and Vessel Finder. Using Vessel Tracker, we can follow the oil tanker, MT Terra Nova, which capsized and sank during a storm in the Bay of Manila last month.
Who is Legally Responsible?
Tracking the source of an oil spill is the first vital step in holding those responsible to account, be it the tanker, the captain or the shipping company.
The IMO governs many of the international and regional agreements aimed at preventing and controlling pollution caused by ships. The International Convention for the Prevention of Pollution from Ships (MARPOL) implements laws to help prevent marine pollution. Whilst the Civil Liability for Oil Pollution Damage requires ships to maintain insurance or other financial security in case they are required to pay environmental damage compensation.
On a regional level, there are numerous ways to report a spill. For example, in the U.S, the EPA offers contacts and links. There are also many tracking tools to monitor how a spill develops, including the European CleanSeaNet Service and NOAA’s Incident Map.
You can also tell us. We’d love to hear from anyone who’s using this guide to investigate environmental incidents. Join our Discord community to share your work and feedback.
Our thanks to Jason Schatz from SkyTruth for their feedback and to satellite image analyst, Samir @obretix for their support and granting research and training access to Sentinel Hub.
Featured cover image: Maxar Technologies
Bellingcat is a non-profit and the ability to carry out our work is dependent on the kind support of individual donors. If you would like to support our work, you can do so here. You can also subscribe to our Patreon channel here. Subscribe to our Newsletter and follow us on Twitter here and Mastodon here.