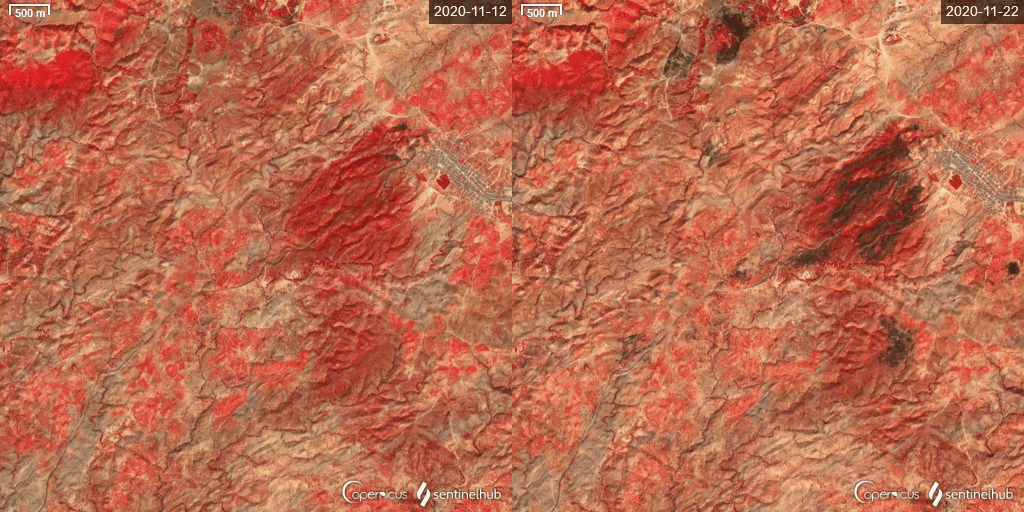
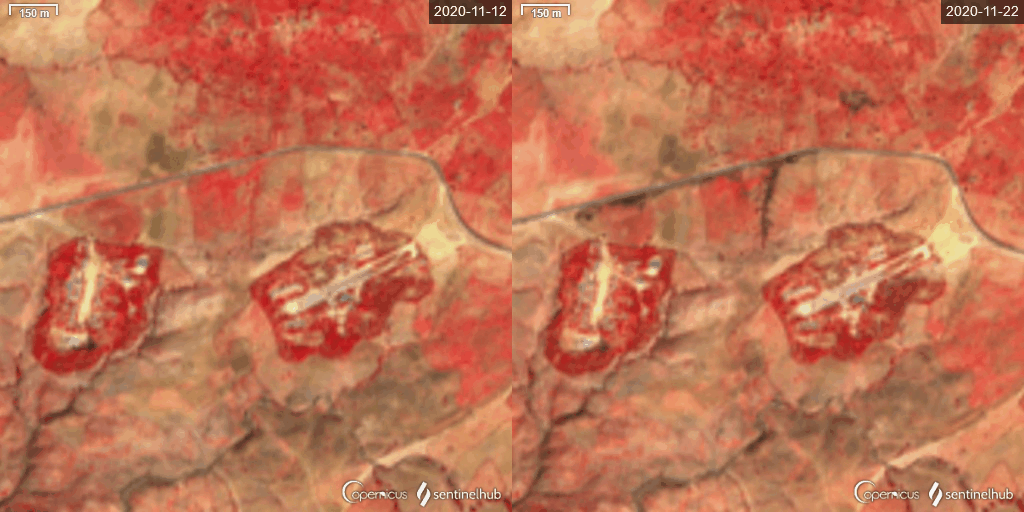
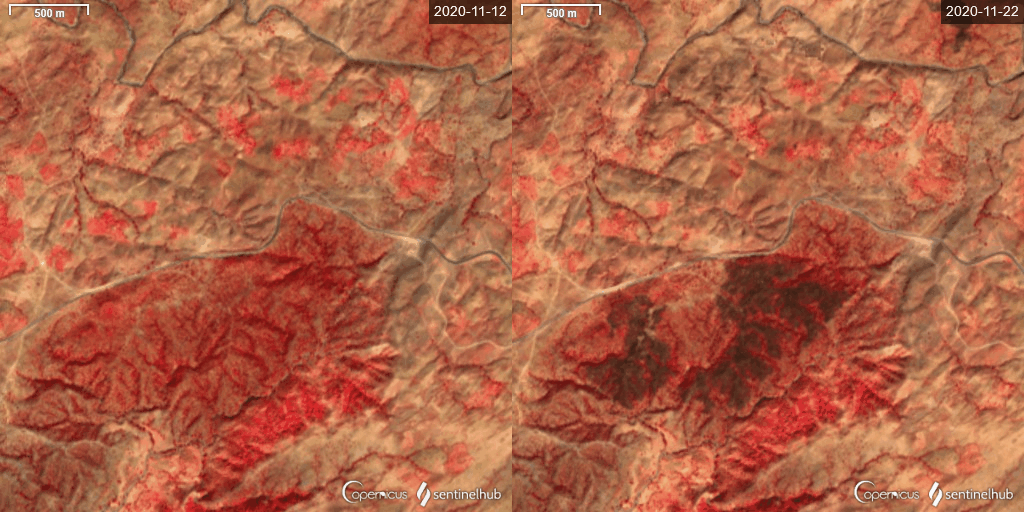
Scorched Earth: Using NASA Fire Data to Monitor War Zones
Satellites are one of the most useful resources in an open source investigator’s toolkit. But eye-in-the-sky imagery can be used for more than just mapping and geolocation. Some satellites also carry instruments with sensors that detect heat – and the data they generate can be used to monitor war zones.
NASA’s Fire Information for Resource Management System, or FIRMS, is a tool that detects active fires and thermal anomalies. It has long been used to track wildfires, including the forest fires that blazed across southern Europe this past summer.
But missile launches, heavy artillery fighting and explosions also generate fires and heat that can be detected.
One researcher, for example, has used the tool to monitor the progress of front lines in southern and eastern Ukraine following Russia’s invasion in February. By comparing FIRMS output from July 2022 with a situation report from the Institute for the Study of War (ISW) for the same month, they found that the fire data followed the forward edge of the battle.
Many analysts have noticed that clusters of fire detections have followed the forward edge of battle pretty closely. Using @TheStudyofWar's analysis of the Russian advances in Ukraine as of July 12, with @NASA FIRMS detections, we can see just how active these areas have been. pic.twitter.com/oV7bDYxNB0
— Amelia Smith (@ameliairheart) July 13, 2022
FIRMS is particularly useful, when social media or access to information may be lacking or restricted.
It must be noted, however, that the tool is rarely sufficient on its own when seeking to establish the cause or presence of, say, an individual explosion. Still, Bellingcat researchers and the open source community have successfully used FIRMS data in conjunction with other tools to narrow down satellite imagery searches and confirm or assess the aftermath of heavy fighting and scorched-earth tactics.
This article will detail a few examples of how FIRMS data has been used to investigate conflict zones in Ethiopia, where a brutal civil war has been raging since late 2020, and show how to use this increasingly valuable and completely free resource for yourself.
With reports suggesting heavy fighting is ongoing in Ethiopia, the methods discussed remain relevant both there and in other conflicts.
What is NASA FIRMS?
Data containing geospatial and descriptive information about fires on earth is collected by the MODIS instrument aboard the Terra and Aqua satellites, as well as the VIIRS instrument aboard the NASA/NOAA Suomi NPP and NOAA-20 satellites.
The system uses algorithms to monitor the emission of mid-infrared radiation from fires and thermal anomalies which can be visualised on a map as hotspots.
A hotspot is a satellite image pixel with high infrared intensity, indicating a heat source. One or multiple active fires can be contained within one pixel.

Top image: A large number of hotspots and active fires detected by FIRMS satellites near Bodrum, Turkey in August 2021. Credit: NASA FIRMS. Bottom image: Satellite imagery from the same location and day showing large smoke plumes corresponding to the fire fronts detected by FIRMS satellites. Credit: European Union. Contains modified Copernicus Sentinel data 2022, processed with EO Browser. Copernicus – Sentinel Hub.
Depending on the instrument used, pixels represent different scales. In MODIS, one pixel represents approximately one kilometre while in VIIRS, one pixel represents approximately 375 metres. The latter therefore generally provides better resolution and a greater response in capturing fires in relatively small areas.

Comparison of MODIS (pink) and VIIRS (red) pixel sizes. VIIRS 375m resolution offers a more granular result than MODIS and, according to FIRMS, provides a greater response detecting fires in relatively small areas. Screen grab source: NASA FIRMS.
Detection probability of fires from space is strongly related to fuel type, fire size, and temperature. The typical minimum size of a fire detected by these instruments is between 100 and 1,000 meters squared, meaning that cooler or smaller fires might not always be detected.
The FIRMS website includes an ‘advanced mode’ where you can switch between layers and instruments to display different combinations of heat data, maps and satellite imagery.
This is a particularly useful feature, as different instruments might be able to pick up different data. However, unfortunately, there’s no guarantee that all satellites will be above the area of interest at the time you need. If there is no satellite coverage then a thermal event or fire that has taken place may not be captured.
Still, FIRMS provides data about fires and thermal anomalies around the world on a daily basis and aims to make the data available within three hours of a satellite observation. The fire maps are updated every five minutes.
Working With The Data
There are important caveats to bear in mind while using FIRMS data (the FIRMS FAQ page contains more detail).
Firstly, not all fires and thermal anomalies shown in war zones represent military activity or fires caused by conflict. They can also be caused by hot smoke, industrial processes, wildfires and agricultural activity.
Cement kilns, for example, do not use an open flame, however, their metal shells can reach temperatures of up to 400 ℃, which produce readings that FIRMS can detect as a hotspot (see figure below).

Example of a cement kiln in Ukraine shown as a hotspot in NASA FIRMS. The heat output from this industrial process can be detected by NASA FIRMS. Satellite image: Google Earth- CNES/Airbus.
Other thermal anomalies may be too small, too cool, not sustained for long enough, or be too far away from the nadir (i.e. the line of sight between the ground and a satellite) to be captured at the moment the satellites pass. Thick cloud cover, heavy smoke, wind direction and tree canopies in heavily forested regions can also contribute to obscuring fires.
False positives can also occur due to bright, reflective surfaces, such as metallic structures.
Incidents of missing or unknown data can also occur. Fires can burn between satellite observations, or on occasions when the instruments are inoperable.
Contextual and geographical knowledge of the location and the conflict is key to using FIRMS data effectively and understanding what it could potentially mean.
Each hotspot detected by FIRMS is accompanied by a confidence level value associated with the quality of the data as well as a Fire Radiative Power (FRP) value, which is related to the magnitude of the fire and can be used to refine questionable fire instances.
VIIRS-pixels come with low, nominal and high confidence values while MODIS-pixels confidence levels are expressed as 0-100%. An explanatory guide on how the detection algorithm works can be found here.
FRP is used to measure the intensity of a fire in megawatts (MW). It provides information on the radiant heat output which is linked to the quantity of fuel being consumed at the time the signal is captured.
Depending on the type and size of the incident you are investigating, you might be interested in hotspots with higher levels of confidence to avoid false positives but also a higher FRP, which could potentially be related to big fires.
While the cement kiln shown earlier registered FRP values up to 2 MW with nominal confidence, the following example shows fires and hotspots in Eastern Ukraine with FRPs up to 500 MW and confidence values of 100%.
If we were tracking fighting in this area, the location of the red pixels in the screenshot below would warrant further investigation.

An example using Fire Radiative Power (FRP) and confidence levels to shortlist data points of interest when monitoring war conflicts. Example from Eastern Ukraine July 6-12 2022. Screengrab source: NASA FIRMS.
Tip
To extend your analysis to larger sets of fire data and overlap it with satellite imagery, maps or other geospatial data, FIRMS archived data is also downloadable either by country or by drawing a bespoke region over the map here. After downloading the data, it can either be imported as a KML file to Google Earth or used with a visualisation tool.
This guide shows how to work with the archived data, downloaded as CSV files, and import it to Google Earth Pro as a KML file.
Again, fire data is not a smoking gun but it can generate important leads which, when combined with other open sources, can prove to be useful in monitoring war zones.
The main two research strategies that are followed when using fire and thermal anomaly data are:
Strategy 1: Geolocation and chronolocation of footage from conflict incidents involving fire.
This video tutorial by Ben Strick provides more information about how to use NASA FIRMS for geolocation.
Strategy 2: Monitoring fire signals to reveal or verify conflict incidents (e.g fighting, attacks, troop movements and scorched-earth tactics).
The remainder of this article will focus on case studies where Strategy 2 has been used by open source researchers to monitor and verify conflict, detailing some of the scenarios where this process has been applicable and fruitful.
Tigray Burning: Using FIRMS for Verification and Monitoring
FIRMS data can be useful when working to verify statements by actors on the ground, even in circumstances where little or no imagery or footage is available. The conflict in Ethiopia’s Tigray Region, which Bellingcat has previously investigated, is one such example.
Journalists struggled to gain access to Tigray to confirm many war incidents and abuse allegations in the months after the conflict began in November 2020.
The ability to document potential war crimes, in a region where internet use among the population was already low, was further hampered by a communications blackout imposed by the Ethiopian government.
With only a trickle of footage posted on social media, researchers became more resourceful in their search for other data points. This is where FIRMS came in.
By monitoring fire data, potential combat zones and military troop movements could be identified, analysed and verified against local reports and other open source data.
Multiple fires were detected in Wereta town (11.92290, 37.69374°) , in Amhara Region, #Ethiopia today : Aug 25th.
⚠️The town is not far from the rapidly changing active combat zone. pic.twitter.com/zi8XmYM6yS— Ted Galt (@Quen10Tarantino) August 25, 2021
Official government reports can be verified too.
On November 12, 2020, Ethiopia’s prime minister, Abiy Ahmed, said government forces had taken control of Shiraro, a town in northwestern Tigray. A few days later the BBC reported that government forces had taken control of Shire, a city to the west of Shiraro. This was reportedly confirmed to local media by leaders of the Tigray People’s Liberation Front (TPLF).
ለስግብግቡ ጁንታ ግፍ እስትንፋሱ፣ ጭካኔ ነፍሱ ነው። ጀግናው የመከላከያ ሠራዊታችን ሽራሮን ሲቆጣጠር፣ እጅና እግራቸውን የፊጥኝ ታሥረው የተረሸኑ የመከላከያ አባላትን አግኝቷል። ጭካኔው ልብ ሰባሪ ነበር። ዓላማው ኢትዮጵያን መስበር ነው። 1/4
— Abiy Ahmed Ali 🇪🇹 (@AbiyAhmedAli) November 12, 2020
In a parliamentary address the following month, Abiy said the Ethiopian National Defence Force (ENDF), headed by Lt. Gen. Abebaw Tadesse, was in control of the cities of Shire and Aksum.
In an interview released on November 22, Lt. Gen. Abebaw was seen further west, in Adwa, around here.

The position of Lt. Gen. Abebaw during a TV interview was locatable by comparing mountain ranges visinle in the background to data available using the Peak Visor tool.
Analyst Ryan O’Farrell reported that the ENDF held a press conference providing details of its troop’s movements. The graphic below, supplied by the ENDF, shows troop advances west from Shiraro towards Adwa, via Shire and Aksum.

A Screen grab from video released by Ethiopian media, described as showing ENDF troops moving from Shiraro towards Aksum. November 22, 2020.
But how could this situation have been monitored in real time, especially with little social media video or footage being posted due to poor connectivity and the internet blackout that was hampering researchers?
FIRMS data shows there were no fires or hotspots visible on the roads connecting Shiraro-Shire-Aksum-Adwa in the month prior to the start of the war.

A screen grab taken from NASA FIRMS showing no fires along the road connecting Shiraro with Aksum during the month prior to the war starting.
However, hotspots were visible after the conflict began. The fact that these hotspots were detected along a road suggests that the fires could have been ignited by human activity (accidental or deliberate) or perhaps fighting.
The sequence of hotspots seen in this NASA Worldview animation show a specific direction of progress, from Shiraro towards Shire and Aksum, between 11 to 20 November 2020, which correlates with the advances reported by the ENDF.

A time-lapsed animation of fire instances detected by NASA FIRMS along the road Shiraro-Aksum between November 11-20, 2020. Source: NASA WorldView.
The data also showed Fire Radiative Power (FRP) values between 0-5 MW with nominal confidence; while hotspots with FRPs ranging from 20-39 MW and high levels of confidence were detected in Adwa and Shire respectively.
The difference between the FRP values could, of course, be associated with multiple factors including the type of fuel (vegetation or man-made materials). Further analysis on potential correlations between FRP, type of vegetation and fire size can be found here.
Delving Further into the Data
With FIRMS providing a lead as to where incidents of interest may have taken place, other platforms, such as the Sentinel Hub EO Browser – a web platform that is free-to-use- provides a wide variety of data and imagery from satellites orbiting the globe – can allow us to delve even deeper into data.
In particular, Sentinel Hub allows users to create different visualisations, download high resolution images and produce timelapses. All these features can be used to search for further correlations with the fires and hotspots analysed with NASA FIRMS or vice versa.
For example, switching on the false colour-near infrared layer in the Sentinel Hub EO Browser revealed scorched vegetation patches along the road from Shiraro to Shire at the site of hotspots detected by FIRMS.
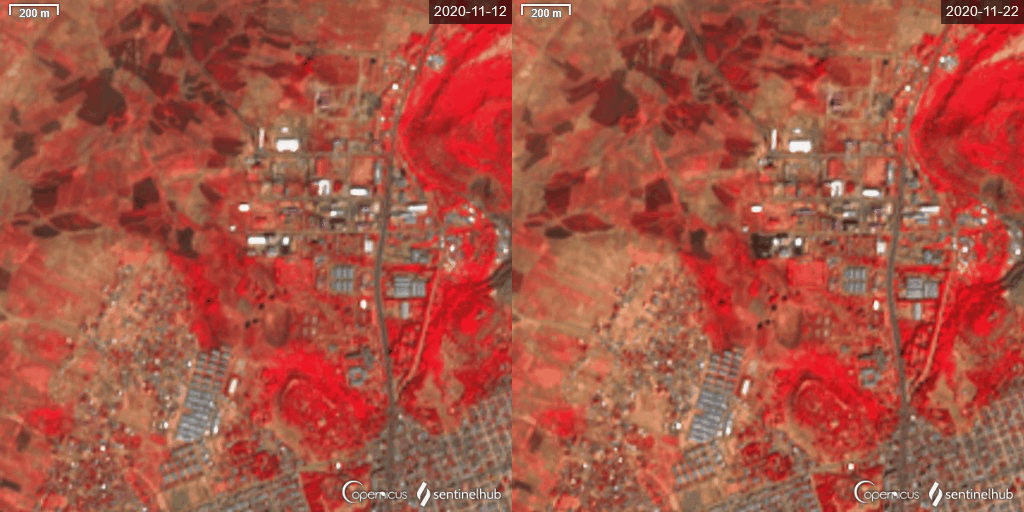
Top: A screen grab from NASA FIRMS showing no fires along the road connecting Shiraro with Aksum during the month prior to the start of the war. Below: Time-lapsed satellite imagery showing scorched marks around 14.44816,37.97409, 14.43901,38.03813, 14.42112,38.10888 and Shire: 14.113139, 38.271333. Credit: European Union. Contains modified Copernicus Sentinel data 2022, processed with EO Browser. Copernicus – Sentinel Hub.
According to the final time-lapsed image, the scorched area corresponds to a series of man-made structures.
A Planet Labs image captured on 17 November, 2020, meanwhile, shows a dark smoke plume rising from the same location, confirming the active fire that was detected by FIRMS.
As can be seen from the first FIRMS image above detailing the road between Shiraro and Shire, the fires/hotspots started close to the border with Eritrea in the early days of the war and more fire instances occurred in chronological order towards Shire and Aksum. This prompted some analysts to question whether the data was showing the movement of the Eritrean Defence Forces and ENDF troops along this route.
Ethiopia has since acknowledged that Eritrean forces were in the Tigray region.
In February 2021, Amnesty International reported a series of abuses in Aksum allegedly committed by the Eritrean Defence Forces (EDF) during this period.
However, it was not possible to prove or verify these claims using FIRMS and satellite imagery alone.
Join the dots….by connecting the date sequence of NASA FIRMS satellite fire detections this map clearly shows two offensive routes starting at the Eritrean border into Tigray. pic.twitter.com/fWgEotceBh
— FIRIS – Fire in Settlement (@FIRIS_FireAlert) December 22, 2020
Spotting Significant Events
Let’s take a look at another case study from a different part of Tigray, further west.
Five groups of fire and thermal anomalies were detected in northwestern Tigray on February 22, 2021.
Historical data from January 2020 until January 2022 taken from FIRMS, and uploaded to the Kepler visualisation tool (below), shows that western Tigray appears to be affected by seasonal or agricultural fires between June and September.
Fires in group one and two in the map above were detected in the Kafta-Sheraro National Park and directly south, a region dominated by vegetation that burns frequently and where fire activity is very high, according to longer-term records. Hotspots in groups four and five, however, warrant further investigation as these areas appear to have had little fire activity in the years prior (visible in February 22 in the GIF below).

Fires in Western Tigray between 2020-2022. According to experts, fire activity here is normally very high due to the type of vegetation. Data visualisation prepared with https://kepler.gl/demo.
The cluster of hotspots in group four were detected along a road in a rural area that had no other record of fires in the previous years. This increases the probability that these fires are unrelated to seasonal burning and could be linked to human activity.
FRP values of up to 20 MW with confidence levels ranging from nominal to high reduces the likelihood of these readings being false positives.
These factors suggest that this location is a good candidate for satellite image tasking in order to investigate a potential war incident.
For example, Reuters reported at the time that satellite imagery showed more than 500 structures had been destroyed in this region, near Gijet town. The Reuters report leaned on work by the DX Open Network group (now known as Vigil Monitor) which analysed satellite images of the area based on an initial FIRMS analysis.
A month later, SkyNews visited the area and reported that hundreds of houses had been destroyed and dozens of people had allegedly been murdered by ENDF soldiers.
Satellite imagery, while still open source when it is commercially available, is extremely useful for all types of investigations. However it can come at a cost to direct or “task” a satellite to take a picture at a precise location. Bellingcat has an agreement with Planet Labs. But other providers such as Maxar also provide this service.
Still, if you do not have access to satellite tasking, you can check freely available satellite imagery sources such as Sentinel Hub EO, which is updated every couple of days.
Depending on when the data has been collected, Sentinel Hub EO allows the cross referencing of hotspots detected by NASA FIRMS or vice versa.
For example, in the previous case study detailing potential troop movements, the VIIRS instrument aboard Suomi NPP and NOAA-20 detected hotspots near Gijet on February 22, 2021.
The Sentinel EO Browser shows satellite imagery at the same location from earlier on the same day, which appears to capture light smoke plumes that indicate potential active fires.

Satellite image captured on February 22, 2021 at 07:56 UTC appears to show smoke plumes at coordinates 13.29949, 39.14819. Satellite images credit: European Union. Contains modified Copernicus Sentinel data 2022, processed with EO Browser. Copernicus – Sentinel Hub.
Oftentimes, however, smoke or burning areas are not so easy to identify on satellite imagery.
Switching on the wildfire visualisation composite layer in the Sentinel Browser will highlight hotspots in a combination of red, orange and yellow to indicate potential active fires with a good correlation with smoke plumes too. This visualisation layer is based on a script from Pierre Markuse using Sentinel-2 data.
This guide shows how to activate the wildfire visualisation on the Sentinel EO Browser.

A timelapse image appears to show thermal anomalies near Gijet.
It is important to note that the highlighted areas do not show confirmed fires; they are just a representation of infrared emissions which, according to Markuse, usually align well with active fires. It is also important to consider that the sensitivity value predetermined in the script using infrared emissions can generate false positives.
Final Notes on FIRMS
NASA FIRMS fire data analysis has become an essential tool for many open source analysts who monitor and research war zones.
As we have learned, it can be used to help verify information and generate investigative leads.
FIRMS data can be available within three hours after it has been captured, which is very quick in comparison to satellite imagery available from services that are free to use.
Analysis of FIRMS fire data, in conjunction with other sources and technical expertise, can also provide the necessary intelligence to task a satellite to gather more evidence. Yet contextual information about the geographical location and the conflict in question should always be considered to eliminate false positives or to understand the potential meaning of the data.
The wildfire layer feature in the Sentinel Hub EO browser can be used to verify fire instances detected or missed by FIRMS. It also helps to visually identify smoke or burning areas that are too small and difficult to spot.
It is important to note that satellite-derived active fire/thermal anomalies have limited accuracy and should be treated carefully. Please read the following disclaimer.
For this report, Bellingcat acknowledges the use of data and/or imagery from NASA’s
Fire Information for Resource Management System (FIRMS) (https://earthdata.nasa.gov/firms), part of NASA’s Earth Observing System Data and Information System (EOSDIS).
We also acknowledge the use of imagery from the Worldview Snapshots application (https://wvs.earthdata.nasa.gov), part of the Earth Observing System Data and Information System (EOSDIS).
Bellingcat is a non-profit and the ability to carry out our work is dependent on the kind support of individual donors. If you would like to support our work, you can do so here. You can also subscribe to our Patreon channel here. Subscribe to our Newsletter and follow us on Twitter here.


