Mapping Where Sex Offenders Can Live
This article was originally posted to the AutomatingOSINT.com blog.
Recently I was listening to an episode of the Freakonomics podcast titled, “Making Sex Offenders Pay – And Pay and Pay” which you can listen tohere. The premise behind the episode was that sex offenders are a bit unique in how they are punished by the legal system in the United States, and I definitely saw some parallels to here in Canada. While this is a blog about performing OSINT and not about criminal justice systems, we are interested in the data behind this story. In particular, during the podcast they discuss the impact that sex offenders can have on real estate prices, as well as some interesting tidbits on the geography of being a sex offender. At about 27:54 in the podcast, the conversation goes:
DUBNER: You can certainly imagine that fear, if you were to learn that a sex offender got out of prison and moved into your neighborhood. And this is where things begin to get costly for you, the innocent homeowner. A research paper by the economists Leigh Linden and Jonah Rockoff found that when a sex offender moves into the neighborhood, “the values of homes within 0.1 miles of an offender fall by roughly 4 percent.” Now, this presumes you live in a neighborhood where a sex offender is allowed to move in. Finding housing is one of the hardest things for a sex offender, since they are prohibited from living anywhere from 500 to 2,500 feet – that’s almost half a mile — from a school, daycare, playground, park, or recreation center. Elizabeth Letourneau told us about an interesting case in Alabama.
LETOURNEAU: Yeah Alabama, there was just a legal decision rendered that basically found at the federal court level that their sex offender registration, and notification, and residence and employment restriction policy, which is called a SORNA, there was a court case against a SORNA per se and the expert testimony involved an individual who showed maps of where sex offenders were permitted to live in Montgomery City, in Montgomery, Alabama. And basically they were the places, the tracts of lands where they could live and be in compliance with the SORNA policy was the airport strips. So you can’t actually live there. So there were very, very, very few parcels of land. I think, I think he reported that 87 percent of the parcels of land in Montgomery City would not be in compliance for a SORNA and so were off limits for anyone who was a registered sex offender.
So this conversation is what piqued my interest, and where this blog post was born. The question being: how can we automatically generate these maps to determine the areas in a city that a sex offender could be allowed to live?
The Approach
So I scratched out some notes (yeah, with pen and paper) which effectively became my pseudocode:
- Take any city and province (or state) and find its latitude and longitude. (geocoding)
- Determine where the boundaries of this city are to give us a search radius. (Wikimapia)
- Search within that radius to find all of the schools within that city. (Wikimapia)
- Output the results to a JSON file.
- Load the JSON into a map and draw circles on a map to show the estimated areas where a sex offender could live. (Google Maps API)
This seemed like a good approach, albeit, a rough one. We know that Wikimapia is not going to be a definitive guide to all schools, and we also know that an offender may be banned from other things like parks, or daycares. You can of course put more intelligence into your script for your local area, but I will leave that as a homework assignment. In this post I am only going to cover the Wikimapia pieces, let me know in the comments if you want me to walk you through the Google Maps API.
Wikimapia
We are going to be using the Wikimapia API as well as the geopy module to handle the distance measurements we will need. This means you should do a quick:
pip install geopy
pip install requests
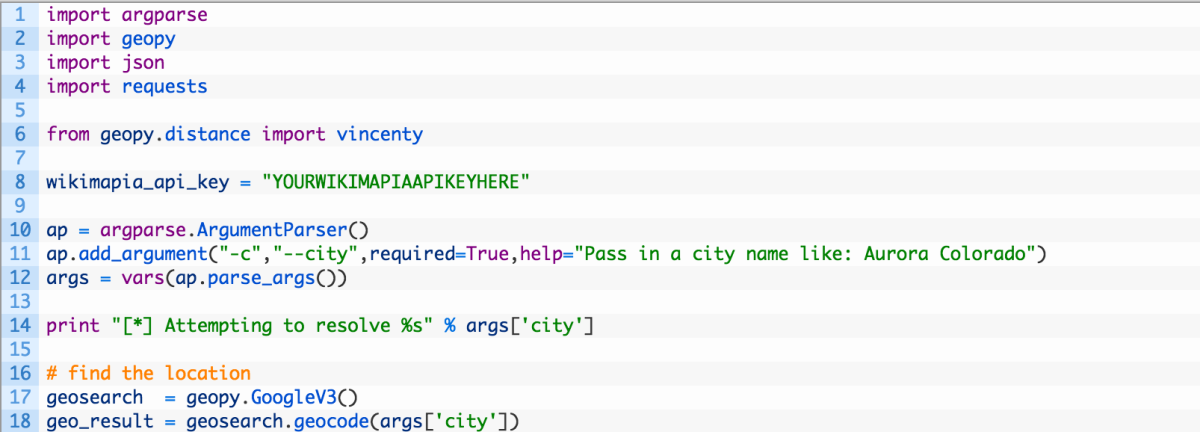
Now open up a new file called sexoffenders.py and start punching in the following code:
Ok so the first chunk of code is pretty straightforward, we are simply importing the libraries that we need, and we give the script the ability to parse command line arguments. We then use that command line argument in our subsequent geocoding search (18). Now let’s start plugging in the main logic of the script.
Let’s take a look at this code:
- Lines 20-24: if we are able to resolve the city name to its coordinates (21) we extract the latitude (23) and longitude (24).
- Line 27: we use the extracted coordinates to then perform a Wikimapia search. Notice that we set the count parameter to 1 and the category parameter to 88. This will limit the search to only a single result back and to only respond with a city category type (cities map to category 88, see their documentation for an explanation). This is because we only want to look at the geographic boundaries for this city.
- Line 29: we send off the API request to Wikimapia.
Ok so this is the first part of our approach, and once we have a response back we need to tease out a bit more information. Let’s add some more code:
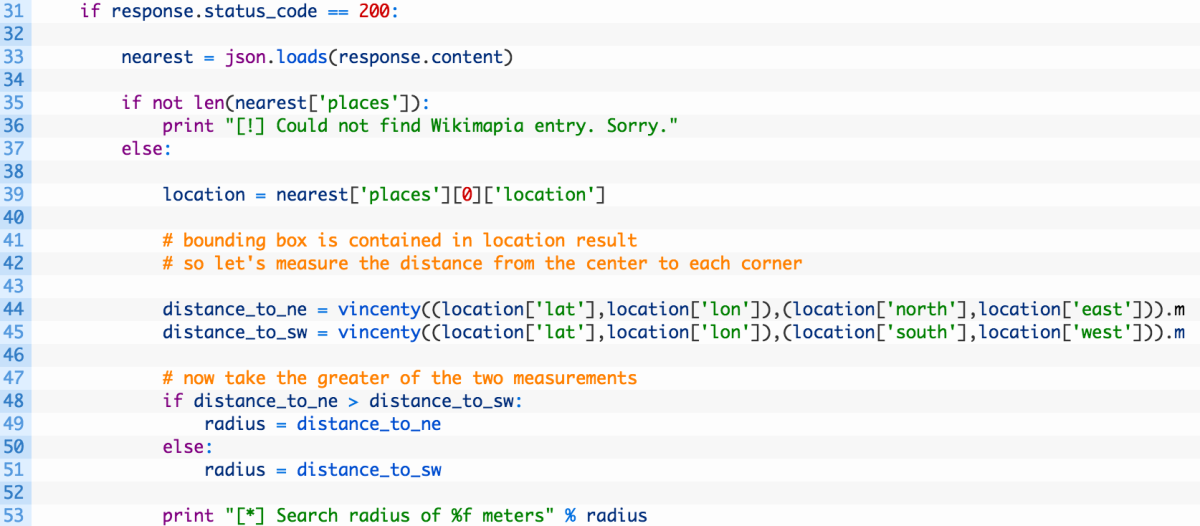
Ok so this is a bit heavier. Let’s break it down a bit:
- Lines 31-37: if we receive a valid response back (31) we parse the JSON (33) and then validate that we received search results from Wikimapia (35).
- Line 39: we pull out the location record from the search results. This includes the bounding box of the city limits as defined by a contributor at Wikimapia. Keep in mind this might not be 100% accurate for every city out there, and won’t include suburbs in some cases.
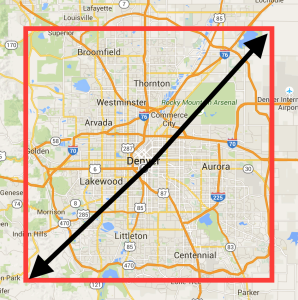
- Lines 44-51: we take the center of the city and measure the distance to the most north eastern corner (44) and the most south western corner (45). We then take the greatest of the two numbers. This gives us a rough radius of the city that we can then perform another search on. See the diagram below:
Ok so this has given us the radius that we want to search within to find all of the schools in a given city. Let’s add the code that will do exactly that.
Another fairly big chunk of code, and remember to be mindful of the indentation (refer to the source if you need to have a reference).
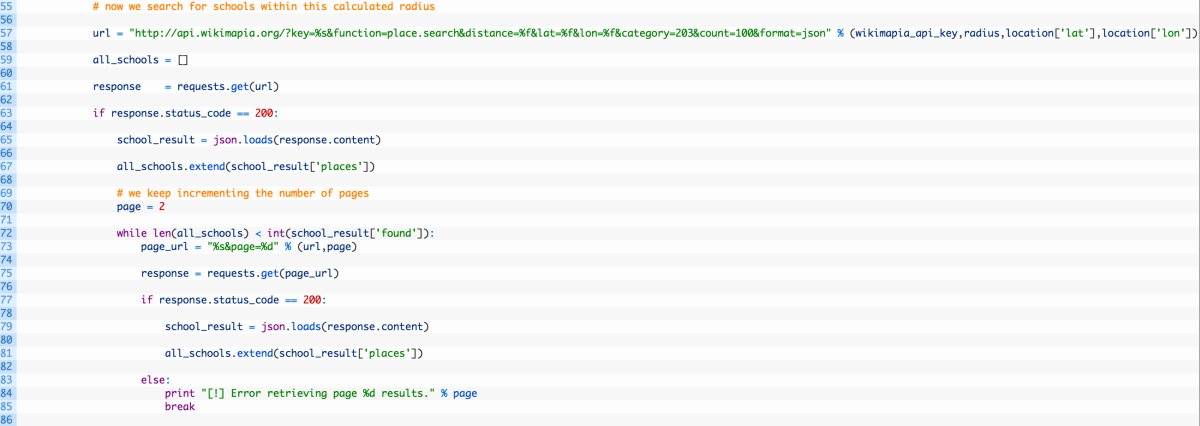
- Line 56: we build up another Wikimapia API url and this time we are sending in the radius we have calculated and have set the category to 203 which corresponds to schools in the Wikimapia database.
- Lines 60-69: we send off the request (60) and if we receive a valid response (62) we add the schools to our list of schools (66).
- Lines 71-86: we are only able to retrieve 100 results at a time, so this loop will continue executing, while incrementing the page variable which will tell the Wikimapia API to “page” through the results (think about clicking on pages of results in a Google search). We continue to add the results to our list of schools stored in the all_schools variable.
Whew! We just have one last thing to do, and that is to take our list of schools and output them to a JSON file so that we can load them into a Google Map. Let’s add the last chunk of code:
This is pretty straightforward stuff. We are just taking our list of schools and then dumping them to a file in JSON format. Since the Google Maps API is handled in Javascript, JSON is very easily parsed and handled by both programming languages which makes it a logical data format to use.
Mapping the Data
Download map.html and place it in the same directory as the sexoffenders.py script. You will need to set your Google Maps API key for the map, so open up map.html and go to line 7:
Now that you have it pasted in, we are ready to test everything out. Make sure that you have dropped in your Wikimapia API key before continuing to the next step.
Let It Rip
If you run the script you should see output like so:
C:/Users/Justin/Desktop> python sexoffenders.py -c “Aurora Colorado”
[*] Attempting to resolve Aurora Colorado
[*] Search radius of 27393.085571 meters
[*] Retrieved 194 schools
Now if you use the built in Python webserver you can go (from the same directory as your sexoffenders.py script):
C:\Users\Justin\Desktop> python -m SimpleHTTPServer
And it will listen on port 8000. If you click the link here:
http://localhost:8000/map.html?radius=500
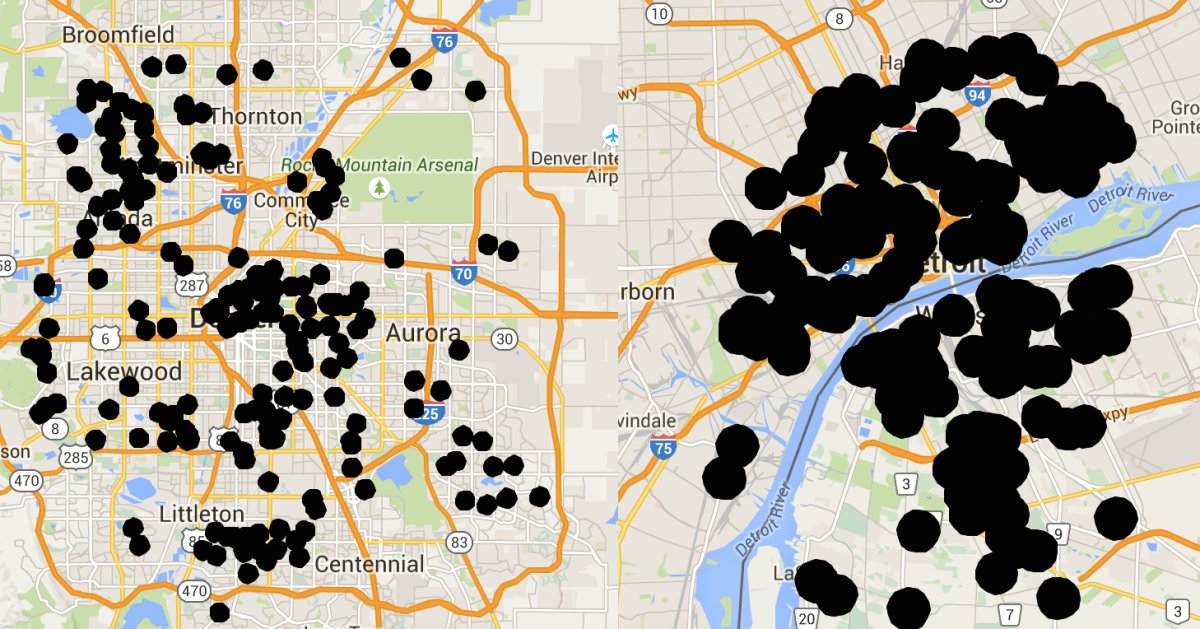
You will see a map of Denver/Aurora, Colorado that has the circles drawn with a 500 meter radius. You can tweak the radius parameter by just changing the number and then watching the output. Then try a completely different locale:
C:\Users\Justin\Desktop> python sexoffenders.py -c “Detroit Michigan”
[*] Attempting to resolve Detroit Michigan
[*] Search radius of 11686.819343 meters
[*] Retrieved 142 schools
Refresh your browser and you should see the updated map that has schools in Detroit shown. Now you can of course begin to tap into local real estate data to see if you can observe what the podcast mentioned. You could also go and search the Colorado registry to see if your map overlays where there are actual sex offenders registered as well. This could also be made into a tiny little self-contained web application using flask or bottle (both Python frameworks) so that it isn’t two steps to get the data or update the map. As always, it is interesting to see what you can do with open source data to answer questions that a podcast may cause you to ask.
